- Dynatrace Community
- Dynatrace
- Ask
- Real User Monitoring
- Mobile-reported errors visualization
- Subscribe to RSS Feed
- Mark Topic as New
- Mark Topic as Read
- Pin this Topic for Current User
- Printer Friendly Page
- Mark as New
- Subscribe to RSS Feed
- Permalink
17 Oct 2022 02:51 PM - edited 17 Oct 2022 05:51 PM
Hi Folks,
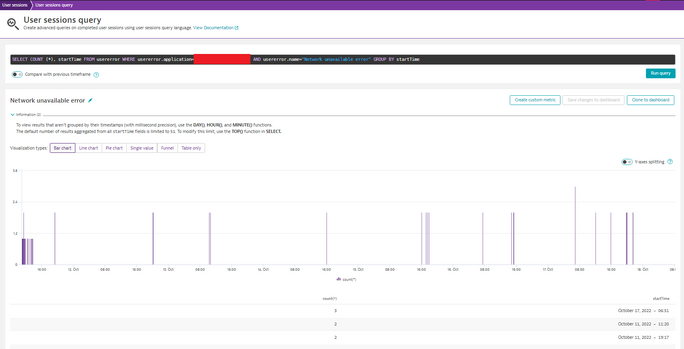
I would like to visualize the mobile-reported errors on a dashboard.
It can be found on the GUI but I would like to see it on a dashboard with other information together.
I have not find any relevant metrics and I could not create a metric for it from USQL.
Do you think is there any way to reach it?
Thanks in advance.
Best regards,
Mizső
Solved! Go to Solution.
- Mark as New
- Subscribe to RSS Feed
- Permalink
18 Oct 2022 08:09 AM
You can use the USQL tile to display the errors. The metric from USQL will be calculated only after a session is closed anyway. There is nothing more you can do right now to display individual errors on a dashboard.
- Mark as New
- Subscribe to RSS Feed
- Permalink
18 Oct 2022 10:04 AM
Hi @Julius_Loman,
Thanks very much for your quick response. I have almost fogotten this dashboard tile. I created many single value tiles from USQL a year ago... I did not define well my problem, I would like graphs instead of single values. I have already found the solution with group by... 😉
Have a nice day.
Best regards,
Mizső


