- Dynatrace Community
- Ask
- Open Q&A
- Process availablility/uptime report
- Subscribe to RSS Feed
- Mark Topic as New
- Mark Topic as Read
- Pin this Topic for Current User
- Printer Friendly Page
- Mark as New
- Subscribe to RSS Feed
- Permalink
16 Oct 2023
08:58 PM
- last edited on
17 Oct 2023
11:58 AM
by
![]() MaciejNeumann
MaciejNeumann
How can I get data about process uptime per month/day in a form of percentage?
I.e. my_service.exe during last month was up for 95% of time.
Is there an API method that returns process/service uptime (or downtime) for a specific date range?
Solved! Go to Solution.
- Labels:
-
processes
-
services classic
- Mark as New
- Subscribe to RSS Feed
- Permalink
16 Oct 2023 10:08 PM - edited 16 Oct 2023 10:10 PM
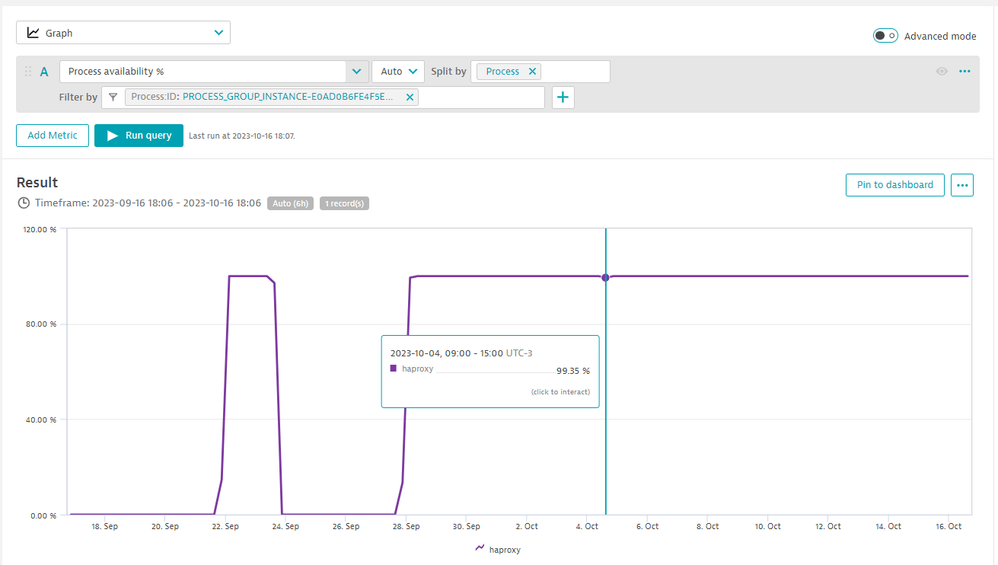
Hi, @olegus , try the metric builtin:pgi.availability, https://www.dynatrace.com/support/help/observe-and-explore/metrics/built-in-metrics#other-process-me...
Combined with the GET Metric Data points API: https://www.dynatrace.com/support/help/dynatrace-api/environment-api/metric-v2/get-data-points
Example:
curl --location 'https://tenant.live.dynatrace.com/api/v2/metrics/query?from=now-7d&metricSelector=builtin%3Apgi.availability%3Afilter(and(or(in(%22dt.entity.process_group_instance%22%2CentitySelector(%22type(process_group_instance)%2CentityId(~%22PROCESS_GROUP_INSTANCE-E0AD0B6FE4F5EBC8~%22)%22)))))%3AsplitBy(%22dt.entity.process_group_instance%22)%3Asort(value(auto%2Cdescending))%3Alimit(20)' \
--header 'Authorization: Api-token dt0c01.4OHVEPBHJGFYCVRCPHAI4FU4.tokenwithrightscope'
If you are looking for a "non supporter technology" or non detected service, you can set up the OS Monitoring Service Monitoring, https://www.dynatrace.com/support/help/platform-modules/infrastructure-monitoring/hosts/monitoring/o... , and then the metric builtin:host.osService.availability, https://www.dynatrace.com/support/help/observe-and-explore/metrics/built-in-metrics#os-service
Try and let us know.
- Mark as New
- Subscribe to RSS Feed
- Permalink
19 Oct 2023 07:41 PM
That kinda works, thx!
Is it possible to use builtin:host.osService.availability metric to get same results ?
Here is my Get from Postman:
{{baseUrl}}/metrics/query?metricSelector=builtin:host.osService.availability&resolution=1M&from=now-1M&to=now&entitySelector=type(os:service), entityName.StartsWith("MyService")&mzSelector=mzName("MyZone")
I cant figure how to select entities, getting this warning:
- Mark as New
- Subscribe to RSS Feed
- Permalink
19 Oct 2023 09:22 PM
There is no entity type as os:service. When configured, the entity type for the OS Service is a Custom_Device, but can be kinda tricky to use the entity selector like this. I suggest you to use the data explorer to create the metric selection there, using the filters by host or by specific OS Service, then call the API.
Example:
builtin:osservice.availability:filter(and(or(in("dt.entity.os:service",entitySelector("type(os:service),entityName.equals(~"My Service~")"))))):splitBy("dt.entity.os:service"):sort(value(auto,descending)):limit(20)Try and let us know.
- Mark as New
- Subscribe to RSS Feed
- Permalink
19 Oct 2023 09:42 PM - edited 19 Oct 2023 09:46 PM
That does not return any results for me, but I played a bit with this metric and I believe I'm going to the right direction -
(builtin:osservice.availability:filter(contains("dt.osservice.display_name","MyService")):filter(or(eq("dt.osservice.status",running),eq("dt.osservice.status",active))):auto/builtin:osservice.availability:filter(contains("dt.osservice.display_name","MyService"))*100)
It seems to return nice results,
the only my concern so far is that it always returns 100% or null , so I'm trying to find any monitored service that was down for some time to prove that data is correct. Null is probably fine as we started to monitor hosts recently (resolution is set to 1w in the request above)
BTW, my goal is to present service availability per a "product", that has multiple hosts, so it means that I need to collect and merge service metrics from all hosts for the related management zone
- Mark as New
- Subscribe to RSS Feed
- Permalink
20 Oct 2023 03:49 PM - edited 20 Oct 2023 04:01 PM
Well.. I'm confused how availability metric is calculated.
I am playing with different options and looks like this short form returns what I need :
(builtin:osservice.availability:filter(contains("dt.osservice.display_name","SQL Server B")))
EXCEPT that result values does not look like percentage to me. For instance, I found a day and time where SQL services were down for a short period and I am trying to get availability metric for "SQL Server Browser" service (see request above) with 1 day resolution and 5 days time period.
This request returns these values:

The metric that is used to show service availability on Host page has a filter for a specific entity ID. :
(builtin:osservice.availability:filter(eq("dt.entity.os:service",CUSTOM_DEVICE-FCB38F0D778F9026))
I'd like to use another filter - filter(contains("dt.osservice.display_name",...) that would in theory return availability for all services from all hosts in the specified management group that fall under this filter.
Is it feasible?
- Mark as New
- Subscribe to RSS Feed
- Permalink
20 Oct 2023 09:54 PM - edited 20 Oct 2023 09:55 PM
Looks like the most reliable way to get an average service availability percentage per all monitored OS services on all hosts that belong to a specific management zone is to query metrics for the specific service and then aggregate numbers in code.
So my workflow is :
- to get all hosts for a specific Mgr Zone using Monitored Entities endpoint:
{{baseUrl}}/entities?pageSize=500&entitySelector=type(HOST), mzName("My_Zone")
- for each host get monitored OS Services using same endpoint:
{{baseUrl}}/entities?pageSize=500&entitySelector=type(os:service),fromRelationship.runsOn(entityId("My_Host_id*")),mzName("My_Zone")'
- for each service get its availability metrics:
{{baseUrl}}/metrics/query?metricSelector=(builtin:osservice.availability:filter(eq("dt.entity.os:service",CUSTOM_DEVICE-XXXXXXXXXXXXXXXXXXXXX)):filter(or(eq("dt.osservice.status",running),eq("dt.osservice.status",active))):sum:auto:sort(value(sum,descending))/builtin:osservice.availability:filter(eq("dt.entity.os:service",CUSTOM_DEVICE-XXXXXXXXXXXXXXXXXXXXX)):sum:auto:sort(value(sum,descending)):splitBy()*100):setUnit(Percent)&resolution=1M&from=2023-10-01 00:00&to=now&mzSelector=mzName("My_Zone")
- from metrics response grab values[] array, in my case it would have just one entry as I need this data per month and I set resolution to 1M
- Mark as New
- Subscribe to RSS Feed
- Permalink
31 Oct 2023 01:49 PM
One more question about this metric - does builtin:osservice.availability consider maintenance windows?
If I have a scheduled maintenance window say, 3 hours weekly on Sundays and outside of this window my service is running 100% , would this metric reflect 3 hours downtime? Would it show 100% for this week or less?
Featured Posts


