- Dynatrace Community
- Ask
- Open Q&A
- Re: Proxy Chain in distributed Traces
- Subscribe to RSS Feed
- Mark Topic as New
- Mark Topic as Read
- Pin this Topic for Current User
- Printer Friendly Page
- Mark as New
- Subscribe to RSS Feed
- Permalink
09 May 2023 12:20 PM
Hi Everyone ,
Can someone please guide me on -to see proxy chain in distributed trace, do we need to add any plugin or by default proxy details are shown?
Thanks
SB
Solved! Go to Solution.
- Labels:
-
distributed traces classic
- Mark as New
- Subscribe to RSS Feed
- Permalink
09 May 2023 01:32 PM - edited 09 May 2023 01:40 PM
Hello.
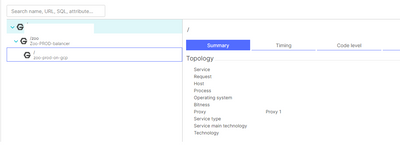
Dynatrace will automatically detects proxy without any plugins from meta-data of requests. For example: if you have HAproxy on host or kube-proxy - you can see this information on ServiceFlow - it will be discovered automatically.
You also can find this information on Trace level (PurePath level) in Summary tab:

On graphics you can also see tips:

For more information and examples I recommend to check Dynatrace blog these great articles: link#1, link#2
Regards,
Alex Romanenkov
- Mark as New
- Subscribe to RSS Feed
- Permalink
10 May 2023 02:45 PM
Further to what @Romanenkov_Al3x already explained, you could enhance the service flow views by adding a more descriptive name for each proxy by adding a custom device, instead of just seeing the IP addresses.
We've also taken it one step further for a customer by integrating it with the F5 BIG-IP plugin, so when one clicks on the name in the right-hand area of the screen, you're taken to the custom device, where you can then click the 'Show details' button and you'll be taken to the F5 plugin metrics for that specific pool.
- Mark as New
- Subscribe to RSS Feed
- Permalink
24 Sep 2024 03:55 PM
How did you do it for the F5 Plugin, have a customer that want's the same for datapower.
Pretty sure I've had this somewhere before, but not able to find anything in the docs.
- Mark as New
- Subscribe to RSS Feed
- Permalink
26 Sep 2024 12:02 PM - edited 26 Sep 2024 03:03 PM
Hi @pahofmann I had to set up custom devices for each of the F5 virtual servers, based on the IPs I saw in the service flow. Once the custom device was configured, with the same IP and a hostname, it detected the proxy in the service flow by the name and not the 'meaningless' IP address. If you configured the custom device to link to the F5 virtual server too, one could do the drilldown from service flow to the actual F5 plugin data directly 🙂
The 'URL of your device' field is what I used to link directly to the F5 plugin's details, specifically the F5 virtual server's details in this case.
I hope that helps - if you need more detail on how to set it up, I'll have to see if I can do a write-up with steps and post it here.
- Mark as New
- Subscribe to RSS Feed
- Permalink
25 Sep 2024 02:41 PM
Hi @Swati_Bhat
It's automatically discovered out of the box by Dynatrace, in case you need to define or customize proxy configurations
for OA deployments use: --set-proxy=172.1.1.128:8080
For AG proxy configuration, feel free to visit: AG Proxy configurations
Regards,
- Mark as New
- Subscribe to RSS Feed
- Permalink
26 Sep 2024 12:11 PM
Hi @Swati_Bhat
You have options to:
- Add F5 extension to get visibility into F5 and F5 entities "instances, virtual server, pool members, interfaces" will be correlated with the monitored entities on the monitoring tenant.
Or
- Create custom device as highlighted by @andre_vdveen.
Simply, you can decide as per the proposed suggestions and actual setup.
KR,
Peter.
Featured Posts


