- Dynatrace Community
- Ask
- Open Q&A
- Re: Response Time Analysis
- Subscribe to RSS Feed
- Mark Topic as New
- Mark Topic as Read
- Pin this Topic for Current User
- Printer Friendly Page
- Mark as New
- Subscribe to RSS Feed
- Permalink
22 Apr 2024
12:58 PM
- last edited on
23 Apr 2024
09:40 AM
by
![]() MaciejNeumann
MaciejNeumann
Dear Members,
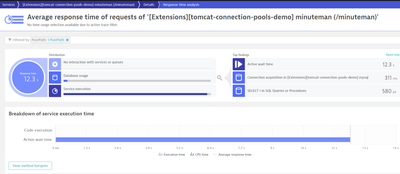
How can we explain time from the below screenshot?
as per the documentation, https://docs.dynatrace.com/docs/platform-modules/applications-and-microservices/services/analysis/se...
Active wait time is not included in the response time? is it right?
thanks in advance.
Solved! Go to Solution.
- Labels:
-
services classic
- Mark as New
- Subscribe to RSS Feed
- Permalink
22 Apr 2024 03:35 PM - edited 22 Apr 2024 03:36 PM
Be careful about
Wait Time: The time during which the code actively waits for something (for example, Object.wait() or a similar functionality).
Active Wait: The time during which the code in this node is waiting for something. The wait caused by child calls is not included.
An example, here the active wait is included
- Mark as New
- Subscribe to RSS Feed
- Permalink
23 Apr 2024 07:40 AM
Thanks,
I saw the definitions in the documnetation,
I was wondering other better explanation.
Thanks
- Mark as New
- Subscribe to RSS Feed
- Permalink
27 Apr 2024 01:07 AM
Hi @Malaik
I was analyzing several scenarios, to better understand how the "Response time Analysis" section is interpreted.
I think I'll see how it works 💪
A) Average Response time ( AVG RT) : Average server-side time of all requests identified in the analyzed TimeFrame.
B ) The "Distribution" section shows the 3 factors that contribute to the AVG Response time, however they DO NOT SHOW the exact times in which they contribute, they only show it in a graph.
( exists form to calculate but depend of scenario, could be easy or dificult)
C) The “Top Findings” section lists the most important hotspots identified by Dynatrace.
To identify the most important points, Dynatrace is applied:
- For Services/queues: Identifies the endpoint with which the analyzed service communicates And calculate the response time contribution of all of them.
- For database: Identifies the database statements within the 3 groups (SQL Query or Procedures / SQL modifications /SQL transactions) And calculate the response time contribution of all of them.
- For Services Execution : Identifies concept contribution time ( Suspension, Code execution, Network IO, Disk IO , Wait Time , Lock Wait, Active Wait , etc )
Of all this, the TOP 3 show that they have the longest contribution time.
That is the reason why the "Top findings" values in very few cases add up to the "Response Time" value.
I have analyzed all of this with different cases, I place the most representative ones.
*In the last image its possible to calculated the Response time because , the service execution have only 3 breakdown, the same breakdown to identify like "Top findings"
8.01 ms + 3.68 ms + 30us ( 0.01ms) = 11.7ms
-------------------------------------------------------------------------------
Returning to the case you present in your image, it seems to be an error in some of the data shown.
According to what was analyzed and found, I would understand that if only "Services execution" exists, it could not be possible for the sum of its values to be greater than the "response time" example.
I hope its helpful 💪
Featured Posts


