- Dynatrace Community
- Ask
- Open Q&A
- Re: Response time spikes on RMI
- Subscribe to RSS Feed
- Mark Topic as New
- Mark Topic as Read
- Pin this Topic for Current User
- Printer Friendly Page
- Mark as New
- Subscribe to RSS Feed
- Permalink
09 Dec 2019 06:48 AM
Hi all,
The application is running on WebLogic 12.2.1.3
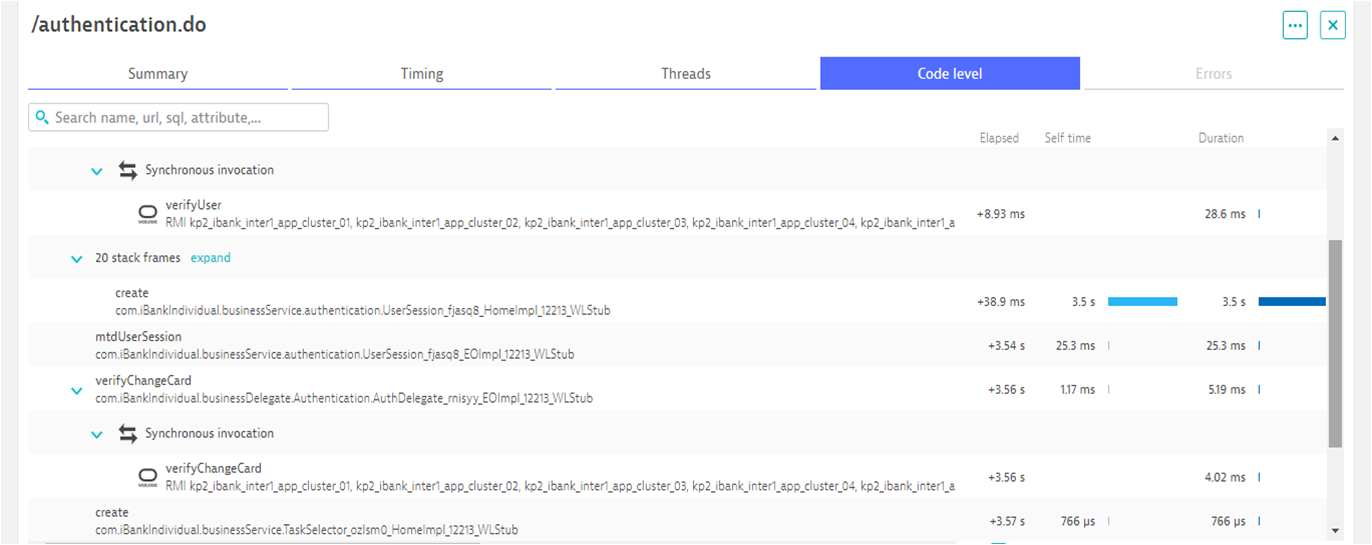
Sometimes, the response time spike when calling RMI to our clustered application tier WebLogics as below

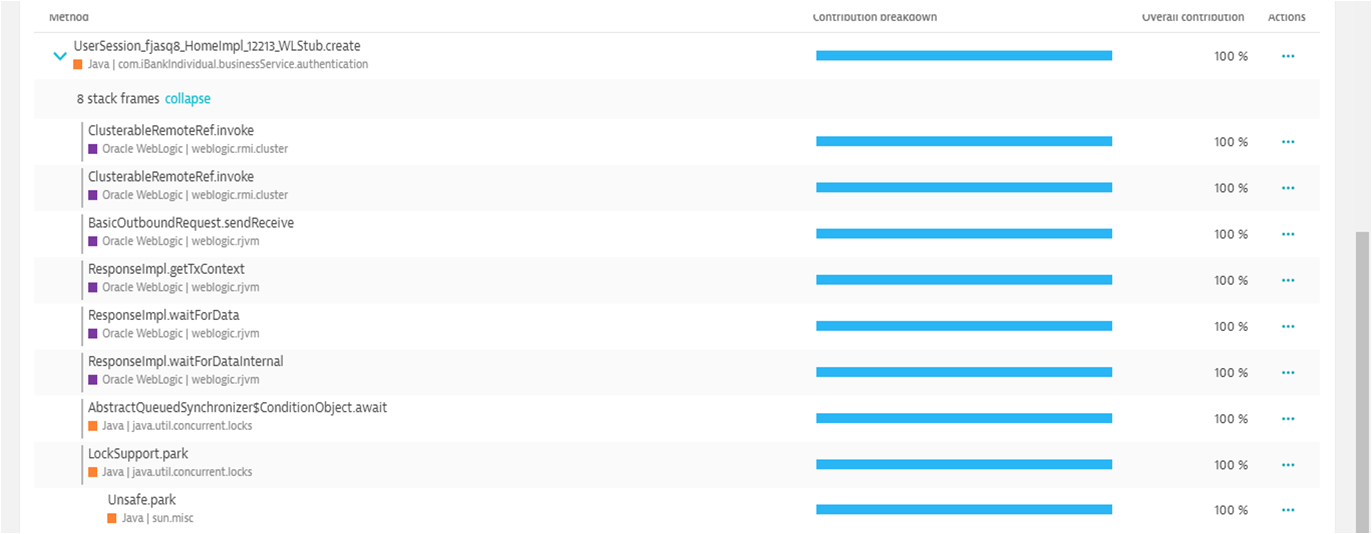
Method hotspots shows it's related with clustered rjvm
Is there anything we need to check to further analyze the issue?
Any advice would be appreciated.

Thank you!
Solved! Go to Solution.
- Labels:
-
java
- Mark as New
- Subscribe to RSS Feed
- Permalink
09 Dec 2019 07:50 AM
It looks like parking transaction while waiting for data. How it looks from other side (system where you are trying to connect via RMI)?
Sebastian
- Mark as New
- Subscribe to RSS Feed
- Permalink
09 Dec 2019 09:27 AM
In the WebLogic RMI server side, the activity traced in DynaTrace is only few ms.
It seems like the time is spent in the client(caller) side while creating the Stub, not the actual call
The question is, what would make this step slow? What should we check to find the root cause?
Thanks
- Mark as New
- Subscribe to RSS Feed
- Permalink
09 Dec 2019 09:47 AM
You should talk about it with developers. Those are WebLogic classes, so downloading classes may not be ideal option here. But you can always try this option.
Good idea may be as well checking WebLogic community, because this may be issue related to particular version.
Sebastian
- Mark as New
- Subscribe to RSS Feed
- Permalink
09 Dec 2019 10:07 AM
I'll try WebLogic community. Thank you
Featured Posts
