- Dynatrace Community
- Ask
- Open Q&A
- Re: Response time x response time measured by caller
- Subscribe to RSS Feed
- Mark Topic as New
- Mark Topic as Read
- Pin this Topic for Current User
- Printer Friendly Page
- Mark as New
- Subscribe to RSS Feed
- Permalink
03 Apr 2023 03:58 PM
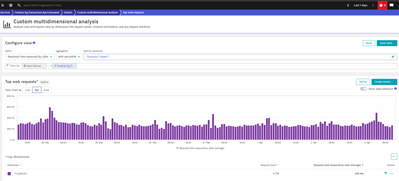
I wanna know the difference between the "Response time" and the "Response time measured by caller".
There is a service called by another service at the same cluster, the latency is small at this cluster but the difference is high when I choose the P95 view. Is it commun?
Response time:
Reponse time measured by caller:
Thanks!
Solved! Go to Solution.
- Labels:
-
distributed traces classic
- Mark as New
- Subscribe to RSS Feed
- Permalink
03 Apr 2023 05:22 PM - edited 03 Apr 2023 05:25 PM
Hi,
This is a two type of metrics (Service metrics and Client-side metrics):
Client-side metrics are measured from the time a request leaves your application to the time the response is received by your application.
Server-side metrics are metrics as the name suggests directly on the server layer
Examples of metrics :
Service metrics:
- Response time
- Request count
- Successful request count
- Failed request count
- Error count
- Failure rate
- HTTP 4xx count
- HTTP 5xx count
- CPU time
- IO time
- Wait time
- Lock time
- Number of calls to databases
- Time spent in database calls
- Number of calls to other services
- Time spent in calls to other services
Client-side metrics
- Response time measured by caller
- Successful request count as seen by caller
- Failed request count as seen by caller
- Failure rate client
- Number request attributes
Below you have an explanation of how this thesis looks at application testing.
Radek
- Mark as New
- Subscribe to RSS Feed
- Permalink
13 Apr 2023 08:52 AM
Hello Radek
this is a very intersting topic for me. I have two additional questions here. Is there any documentation where you have found this list of metrics seperated by server and client?
Second: Which prerequisite has to be fulfilled to get the 'response time measured by caller' out of the Dynatrace API? I can't find this metric there. I think that this is not the same as the built in metrics for client-side response time and should not be mistaken.
I hope you can help me to get further details.
Thanks and best regards
Jan
- Mark as New
- Subscribe to RSS Feed
- Permalink
13 Apr 2023 09:29 AM
Hi Jan,
Hi,
You can find the types of metrics that are available in Dynatrace here: https://www.dynatrace.com/support/help/shortlink/built-in-metrics#response-time - I've highlighted the section for Response Time for you right away.
In general, these metrics are commonly used in application monitoring tools. You can find a lot of information not only in our documentation, but also on the Internet. Here you have a cool example for client-side: https://cloud.google.com/bigtable/docs/client-side-metrics
or
https://www.indeed.com/career-advice/career-development/server-performance-metrics
Response time measured by caller is builtin:service.response.client.
Regards,
Radek
- Mark as New
- Subscribe to RSS Feed
- Permalink
14 Apr 2023 12:38 PM
Hello Radek
thank you very much for your explanation.
Where do you have the information from? The Dynatrace documention doesn't tell anything about the intention of the metrics (following your link above that was already familiar to me). These metric descriptons would be essential for us.
Same for the connection of Response time measured by caller and builtin:service.response.client. Where is this relationship documented?
- Mark as New
- Subscribe to RSS Feed
- Permalink
14 Apr 2023 12:42 PM
Having these metrics described better in the documentation would be incredibly useful. I just went down this same rabbit hole a few months ago and it was not easy to find the answers that should just be in the documentation
Featured Posts


