- Dynatrace Community
- Ask
- Open Q&A
- System.Data.SqlClient.SqlException
- Subscribe to RSS Feed
- Mark Topic as New
- Mark Topic as Read
- Pin this Topic for Current User
- Printer Friendly Page
- Mark as New
- Subscribe to RSS Feed
- Permalink
12 Sep 2019
01:59 PM
- last edited on
31 Aug 2022
11:52 AM
by
![]() MaciejNeumann
MaciejNeumann
I am getting this error and I want to see what was the connection pool usage at this time.
How can I see this
Solved! Go to Solution.
- Labels:
-
databases
-
problem detection
- Mark as New
- Subscribe to RSS Feed
- Permalink
12 Sep 2019 02:42 PM
Hello @Prasad L.
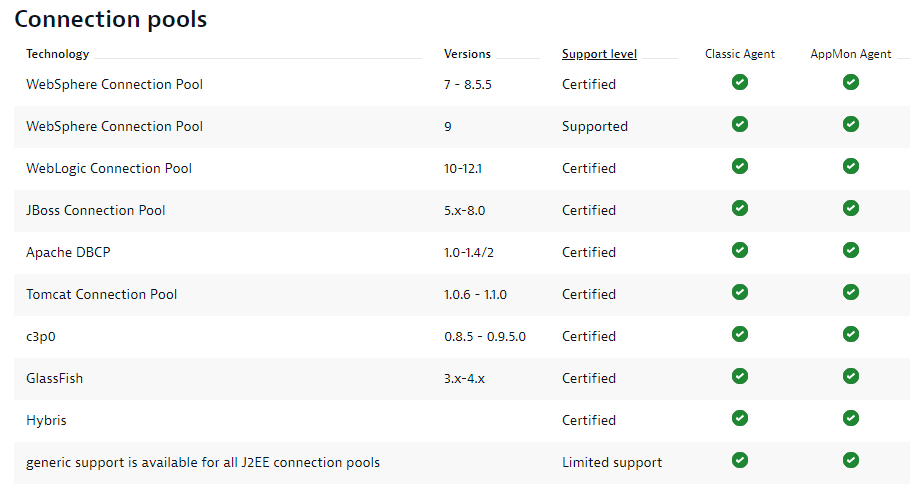
First of all, connection pools information is available for the following technologies if you are talking about AppMon.

If you have anyone supported technology, then open the Database Dashlet to know about the pool usage or create a service-side performance chart for the connection pool size, percent used, etc.
Regards,
Babar
- Mark as New
- Subscribe to RSS Feed
- Permalink
21 Jul 2022 09:56 AM
Can you please guide me on how we show database connection pool usage.
I am getting errors like JDBCConnectionException: Unable to acquire JDBC Connection and HikariPool-***** - Connection is not available, request timed out after ***** and I have database connection pool size 5000, so I want to check actually how many connection pool is used for how much load.
Thanks & Regards,
Sanket_Molavade.
- Mark as New
- Subscribe to RSS Feed
- Permalink
22 Jul 2022 07:32 PM - edited 22 Jul 2022 10:30 PM
Hello @Sanket_Molavade ,
In Settings -> Monitoring -> Monitored technologies, you'll find JBoss Connection Pools, Tomcat Connection Pools, WebLogic Connection Pools, and WebSphere Liberty Connection Pools that can be enabled. I believe these metrics are not enabled by default as they consume DDU licenses.
Once enabled, you'll find the metric in Data Explorer, e.g. builtin:tech.tomcat.connectionPool.numActive
You mention Hikari - I don't believe that will be included under Tomcat. There is facility to add jmx extensions: Monitoring -> Monitored technologies -> Add new technology monitoring -> Add JMX/PMI extension. You'll have to know the schema - and I don't have personal experience to advise if Hikari exposes it's connection pool metrics there...
Featured Posts
