This website uses Cookies. Click Accept to agree to our website's cookie use as described in our Privacy Policy. Click Preferences to customize your cookie settings.
Open Q&A
If there's no good subforum for your question - ask it here!
Turn on suggestions
Auto-suggest helps you quickly narrow down your search results by suggesting possible matches as you type.
- Community Home
- Platform
- Open Q&A
- Traces not available for IIS App Pool service.
Options
- Subscribe to RSS Feed
- Mark Topic as New
- Mark Topic as Read
- Pin this Topic for Current User
- Printer Friendly Page
Options
- Mark as New
- Subscribe to RSS Feed
- Permalink
31 May 2023
03:30 PM
- last edited on
01 Jun 2023
08:08 AM
by
![]() MaciejNeumann
MaciejNeumann
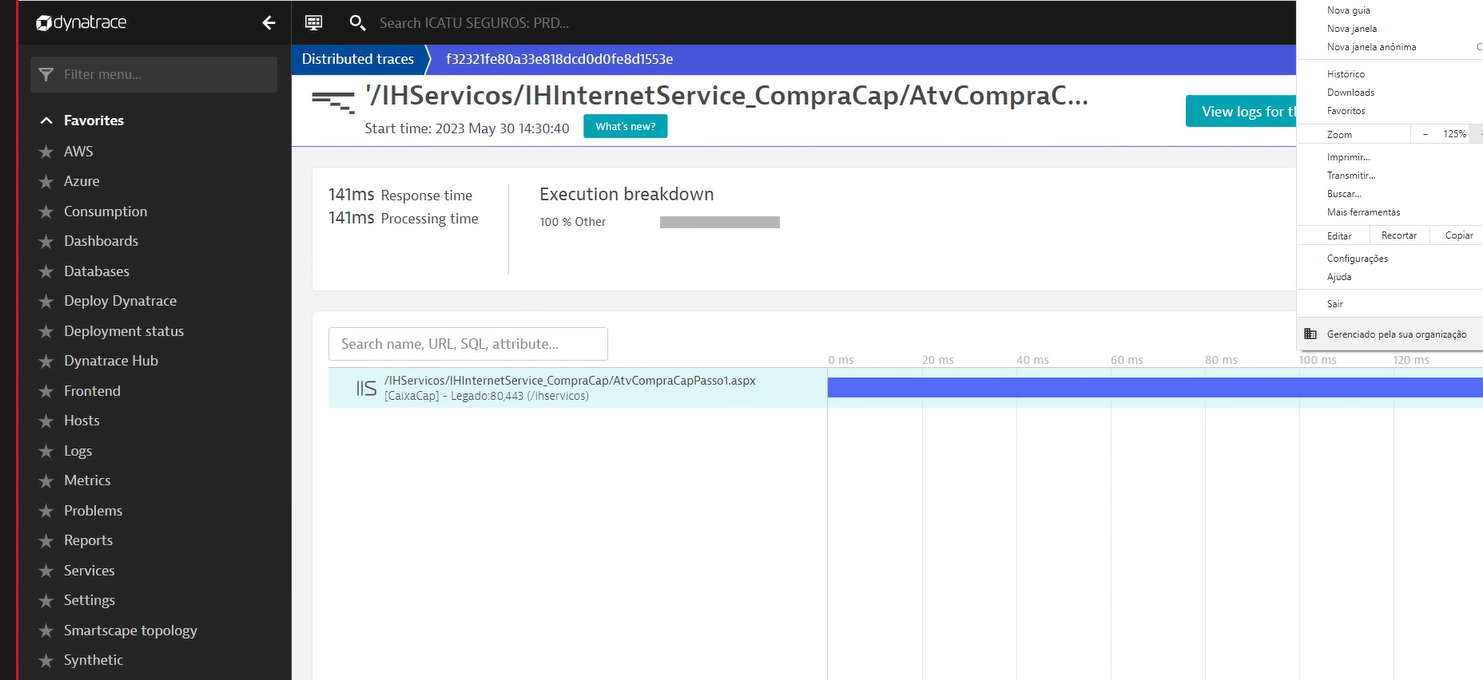
Hello folks, our dev team is not being to see the traces details from a service that runs on IIS APP POOL. They are able to see the Distributed Traces list however when they choose the Trace option they are not able to see the Execution breakdown. I attached the screenshots below.
Is there something missing in Dynatrace for them see the Execution breakdown for those Traces?
Please advise.
Alex.
Solved! Go to Solution.
Labels:
4 REPLIES 4
Options
- Mark as New
- Subscribe to RSS Feed
- Permalink
31 May 2023 07:12 PM
What technologies are used in the application? It looks like an unsupported technology is used or the support is not enabled. I'd recommend checking what kind of framework within the AppPool is used and then check if the OneAgent feature for it is enabled.
Dynatrace Ambassador | Alanata a.s., Slovakia, Dynatrace Master Partner
Options
- Mark as New
- Subscribe to RSS Feed
- Permalink
01 Jun 2023 05:54 AM
Hello Julius
the service main technology is IIS App Pool and the Process technology is .NET. Aren't those technologies supported and enabled by default in OneAgent feature?
Options
- Mark as New
- Subscribe to RSS Feed
- Permalink
01 Jun 2023 07:39 AM
Yes, they are. But still there can be a library used within the application which is not supported or some opt-in features have to be turned on.
You can do a method hotspots on a set of traces and have a look on the classes which are used, but it's best to talk to the developers to check what is used in the application.
Dynatrace Ambassador | Alanata a.s., Slovakia, Dynatrace Master Partner
Reply
Options
- Mark as New
- Subscribe to RSS Feed
- Permalink
01 Jun 2023 03:57 PM
Hello Julius, I will check with the developer about any feature he might use for this app. Thank you very much for the assistance.
Featured Posts
