- Dynatrace Community
- Dynatrace
- Ask
- Open Q&A
- purepaths not showing my methods/code for .net
- Subscribe to RSS Feed
- Mark Topic as New
- Mark Topic as Read
- Pin this Topic for Current User
- Printer Friendly Page
purepaths not showing my methods/code for .net
- Mark as New
- Subscribe to RSS Feed
- Permalink
05 May 2021 05:24 PM
All my my .net purepaths are not showing any of my classes/methods of my application but rather just generic tags like web request, synchronous invocation, asynchronous invocation, sync work SendAsync, etc.
How can I see the call structure/stack of my application?
- Labels:
-
dotnet
-
dynatrace saas
- Mark as New
- Subscribe to RSS Feed
- Permalink
05 May 2021 05:54 PM
what i'd like to see is a full stack / hierarchy of calls like we had in appmon.
- Mark as New
- Subscribe to RSS Feed
- Permalink
05 May 2021 06:59 PM
Those points in the code-level are instrumentation points - places where instrumentation of the code (or errors) happened. Typically instrumentation provided by built-in sensors.
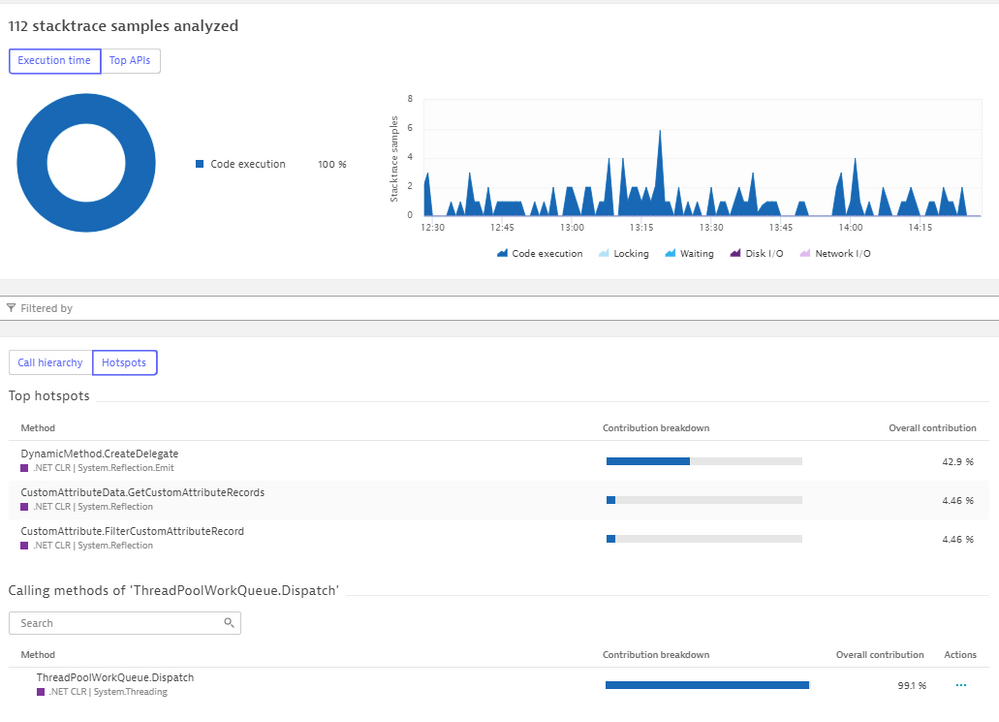
For full stack hierarchy - I believe you want to see the method hotspots view. Either for the selected PurePath or for set of requests.
See the following topic - or just open method hotspots for your currently analyzed context.
https://www.dynatrace.com/support/help/shortlink/service-hotspots#code-level-visibility
If this is not what you are looking for, can you describe your use case?
- Mark as New
- Subscribe to RSS Feed
- Permalink
05 May 2021 08:50 PM
When my web requests are slow I'm trying to determine the cause. What I find when I drill in is generic information that doesn't seem helpful in diagnosing the issue.
- Mark as New
- Subscribe to RSS Feed
- Permalink
27 Apr 2022 02:38 PM
Hello, I have the same issue, finally is it working now for you ?
In code level, I don't see any call to my method, just the System one..

