- Dynatrace Community
- Ask
- Open Q&A
- trying to filter time frame when looking at public networks
- Subscribe to RSS Feed
- Mark Topic as New
- Mark Topic as Read
- Pin this Topic for Current User
- Printer Friendly Page
- Mark as New
- Subscribe to RSS Feed
- Permalink
18 Sep 2018 04:29 PM
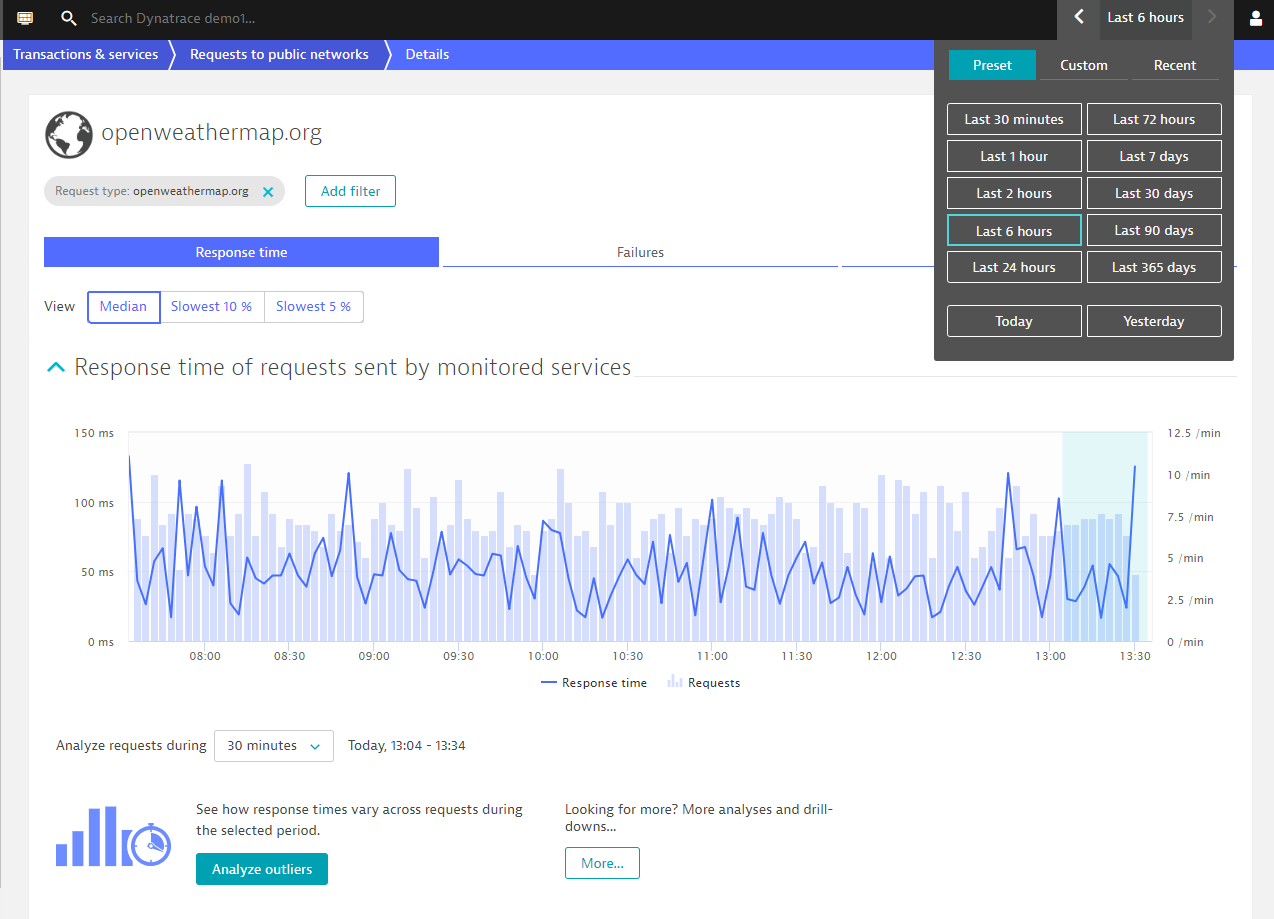
I like the 'Requests to Public Networks'. (Wish there were some way I could put it on my dashboard.) I am particularly interested in requests to one domain. When I pick that domain, though, I only seem to be able to look at 'the last 10 minutes', or 'the last 15 mins', or 'the last 30 mins', or 'the last hour'. I wish there were some way that I could pick the time frame that I want to look at. Also, for this particular endpoint, response code 455 is not really an error. I wish I could exclude it. I guess I'm saying I wish there were any easier way to apply filters to your requests.
Solved! Go to Solution.
- Labels:
-
network monitoring
-
process groups
- Mark as New
- Subscribe to RSS Feed
- Permalink
18 Sep 2018 06:42 PM
Where are you looking that you're only seeing those limited timeframes? The global timeframe selector should always work - are you sure you're not looking at the analysis window selector that shows up under the chart? Please post a screenshot if that's not the case.
You can edit the error detection at the service level (e.g. Requests to public networks) but I don't think you can edit that for individual requests which it sounds like what you would want. If you're only interested in analyzing these response codes though you can use the filter to include only the ranges you're interested in.


James
- Mark as New
- Subscribe to RSS Feed
- Permalink
18 Sep 2018 07:36 PM
Thank you for your answer! I'm a 'newbie' to DynaTrace, so I didn't know about the 'timeframe selector' in the upper-right-hand corner.
Featured Posts
