Turn on suggestions
Auto-suggest helps you quickly narrow down your search results by suggesting possible matches as you type.
- Dynatrace Community
- Dynatrace
- Extend
- Dynatrace API
- Re: Container CPU via REST API
Options
- Subscribe to RSS Feed
- Mark Topic as New
- Mark Topic as Read
- Pin this Topic for Current User
- Printer Friendly Page
Options
- Mark as New
- Subscribe to RSS Feed
- Permalink
06 Nov 2020 07:00 PM
Hi,
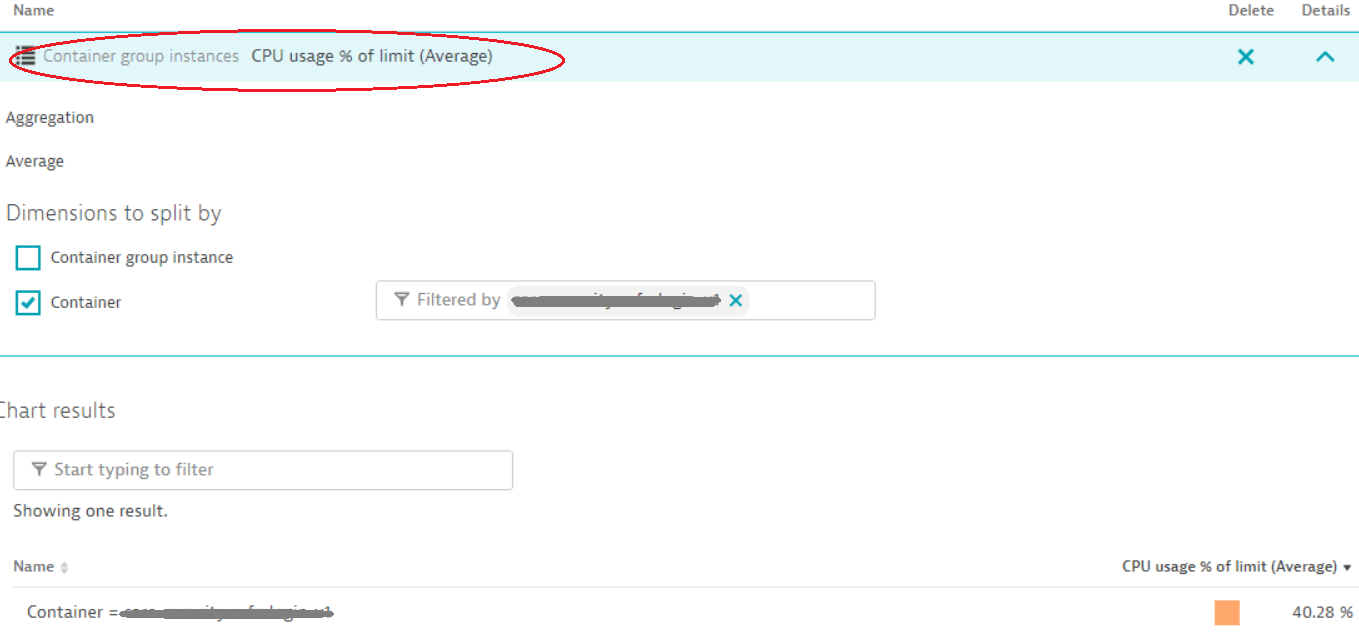
I need to get via REST API the metric "Container group instances --> CPU usage % of limit" that I'm able to successfully get from dashboard:
I built this REST API call:
https://dynatrace.domain.com/e/9o04760a-3eec-48f1-876d-98ecfd8136hq/api/v2/metrics/query?metricSelector=builtin%3Acontainers.cpu_usage2:names:avg:filter(eq(Container_name,mycontainer))&resolution=Inf&from=now-2h&mzId(812622435820523696)&Api-Token=y-d7gYZQQbxtxqYtAxiLQ
but it returns empty "data":[]:
{"totalCount":4846,"nextPageKey":"___a7acX3q0AAAAGAQBXYnVpbHRpbjpjb250YWluZXJzLmNwdV91c2FnZTI6bmFtZXM6YXZnOmZpbHRlcihlcShDb250YWluZXIsY29yZS1zZWN1cml0eS13Zm1sb2dpbi12MSkpAQAAAAAAAABkAQAAAXWe5wjdAAABdZ55K90AAAF1nucI3QEBAAABAEB2dTlOUlZSUzNxMEFoQWRrQUFFQUdFeHNWV1JaYlhVMVV6Sk9NRXh6SzNOS1EzaDFlVTVyUGI3dlRVVlVVdDZ0___a7acX3q0","result":[{"metricId":"builtin:containers.cpu_usage2:names:avg:filter(eq(Container,mycontainer))","data":[]}]}
What's wrong with the API REST call?
Solved! Go to Solution.
Labels:
- Labels:
-
dynatrace api
-
kubernetes
-
openshift
2 REPLIES 2
Options
- Mark as New
- Subscribe to RSS Feed
- Permalink
09 Nov 2020 04:51 PM
Is your container really named 'mycontainer'?
Have you tried playing with the API Explorer and see what it takes to return valid data. This is a very helpful tool in this type of exploration. The API Explorer can be found under Settings -> Integration -> Dynatrace API then click on Dynatrace API Explorer at the top of the page.
Options
- Mark as New
- Subscribe to RSS Feed
- Permalink
09 Nov 2020 04:54 PM
One approach could be to remove the filter you've applied to see if you even get any data back. If you do, then at least you know it's your filter that's causing no data. Or try a different metric with the same data. Try a larger timeframe. Try removing resolution. Explore a simpler command to determine what's limiting your data returned.
