Turn on suggestions
Auto-suggest helps you quickly narrow down your search results by suggesting possible matches as you type.
- Dynatrace Community
- Dynatrace
- Extend
- Dynatrace API
- Re: where i get below image in Dynatrace API.?
Options
- Subscribe to RSS Feed
- Mark Topic as New
- Mark Topic as Read
- Pin this Topic for Current User
- Printer Friendly Page
Options
- Mark as New
- Subscribe to RSS Feed
- Permalink
13 Nov 2018
12:07 PM
- last edited on
24 Apr 2023
02:04 PM
by
![]() MaciejNeumann
MaciejNeumann
i want to configure JMX metrics in Dynatrace API.i followed below URL.but i didnt get that window.please help on this.
https://www.dynatrace.com/news/blog/jmx-plugins-editor-now-available-eap/
Solved! Go to Solution.
Labels:
- Labels:
-
dynatrace api
-
extensions
-
java
6 REPLIES 6
Options
- Mark as New
- Subscribe to RSS Feed
- Permalink
13 Nov 2018 01:57 PM
You should get Further details button on JMX process dashboard. Click on it and there should be your metrics available.
Regards, Sebastian
Options
- Mark as New
- Subscribe to RSS Feed
- Permalink
13 Nov 2018 02:51 PM
Hi Sebastain,
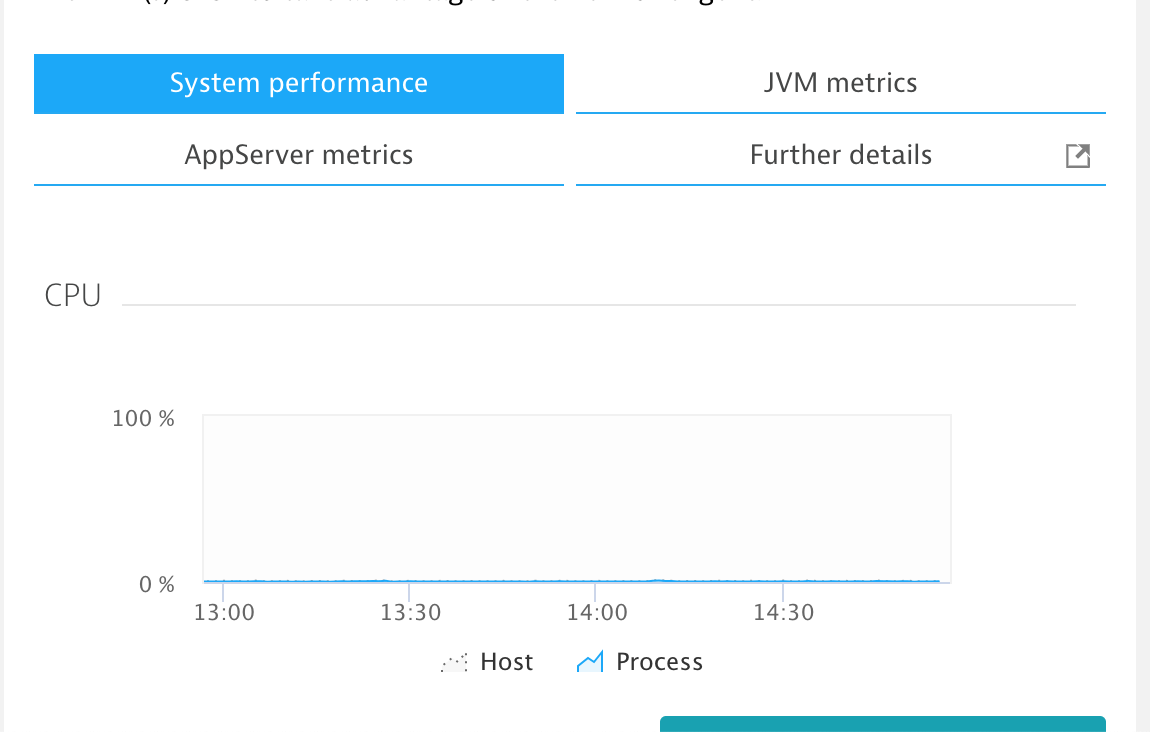
if i click on JVM metrics below window was opening.but i want to configure some more metrics.i want to selec those attributes from mbeans.but i didnt get that window.please suggest on this.jvm.jpg
Options
- Mark as New
- Subscribe to RSS Feed
- Permalink
14 Nov 2018 11:33 AM
They will not show up in JVM metrics but in Further details.
Regards, Sebastian
Options
- Mark as New
- Subscribe to RSS Feed
- Permalink
15 Nov 2018 06:43 AM
Hi,
I clicked on further details only.for that result is above image..
Options
- Mark as New
- Subscribe to RSS Feed
- Permalink
02 Jan 2019 03:15 PM
Hello,
The screen you mention is part of the JMX Editor. This was in EAP in previous versions, you to be able to reach that screen, you need previously to enrol the EAP program (see the documentation https://www.dynatrace.com/support/help/early-acces... )
This functionality will be general available in version 159. It will be accessible in Settings ->
-> Monitored Technologies -> Add New Technology Monitoring -> Add JMX plugin - > Use JMX plugins editor
Reply
Options
- Mark as New
- Subscribe to RSS Feed
- Permalink
23 Jan 2019 06:52 AM
According to the latest official information the JMX Editor is expected to arrive with 1.162.
Reply
