- Dynatrace Community
- Ask
- Real User Monitoring
- Re: DEM Server Time vs PurePath Response/Processing
- Subscribe to RSS Feed
- Mark Topic as New
- Mark Topic as Read
- Pin this Topic for Current User
- Printer Friendly Page
- Mark as New
- Subscribe to RSS Feed
- Permalink
02 Feb 2021 06:48 AM
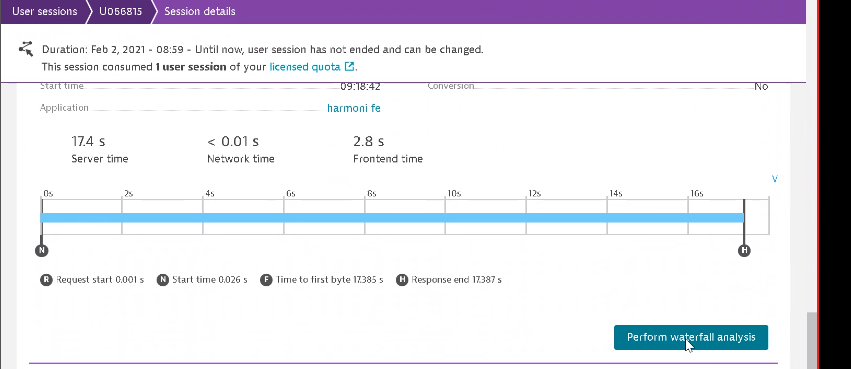
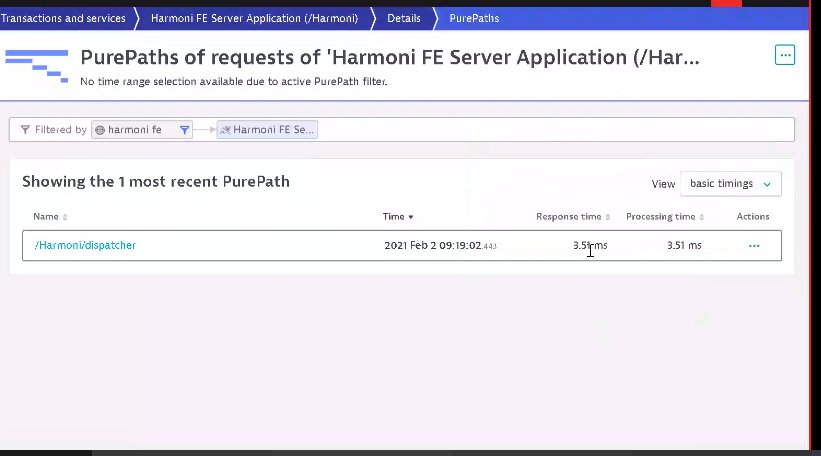
There is a discrepancy between RUM Server Time and PurePath data. You can see that it shows 17 seconds Server Time in waterfall analysis, but when we dive into PurePath of this action, we only get 3.53 ms.
Is there something missing in the middle or am I trying to analyze this in a wrong way?


Solved! Go to Solution.
- Mark as New
- Subscribe to RSS Feed
- Permalink
02 Feb 2021 09:21 AM
What do you see in waterfall? You can have not all purepath collected for this user action, ot problem was somewhere between request and response and it wasn't caused by server performance but browser or network.
Sebastian
- Mark as New
- Subscribe to RSS Feed
- Permalink
02 Feb 2021 11:20 AM
Apart from the waterfall Sebastian mentions, is there anything between the application server and client apart from the network? (Load balancer / reverse proxy / etc).? For example reverse proxy running on low connection pool.
I remember sometimes browser reporting server time instead of network. The categories (network/server/client) is reported by the user's browser and may not be precise.
- Mark as New
- Subscribe to RSS Feed
- Permalink
02 Feb 2021 11:50 AM
We're trying to get and analyze TCP dumps and check where this time is spent. Do you guys have any suggestions about the way we do it?
- Mark as New
- Subscribe to RSS Feed
- Permalink
02 Feb 2021 01:08 PM
If you are able to reproduce it you can always use Wireshark or similar tool for collection of data.
Sebastian
Featured Posts
