This website uses Cookies. Click Accept to agree to our website's cookie use as described in our Privacy Policy. Click Preferences to customize your cookie settings.
Real User Monitoring
User session monitoring, key user actions - everything RUM.
Turn on suggestions
Auto-suggest helps you quickly narrow down your search results by suggesting possible matches as you type.
- Dynatrace Community
- Ask
- Real User Monitoring
- DOM Interactive timing not reflecting the readiness/interactive state of page
Options
- Subscribe to RSS Feed
- Mark Topic as New
- Mark Topic as Read
- Pin this Topic for Current User
- Printer Friendly Page
Options
- Mark as New
- Subscribe to RSS Feed
- Permalink
15 May 2020 07:33 AM
Hi,
We are in a process of choosing the Key performance metric for our Key user action which best describe the user experience of end customer. We were assessing the DOM Interactive metric for some of load action. What we found is that DOM Interactive timing is not reflecting the interactive state of page.
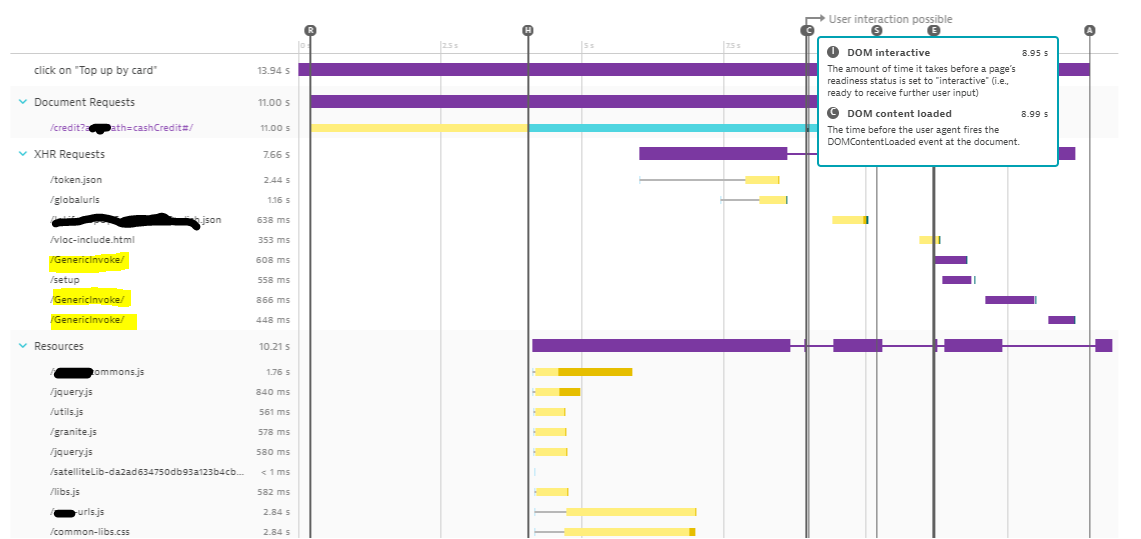
See below waterfall for one of load action, app team said that until the XHR request highlighted in yellow are completed, page in not ready to receive the input.
Looking at the timing
DOM interactive =8.95 s
Yellow request started after DOM complete at 11:10 s
Last Yellow call finished at 13:68 s
As per app team page will be interactive after 13.68 where as DT saying it is interactive at 8.95 s. Can someone explain how DT detect interactive state of page?
In such scenario how we should choose the metric.
Thanks
Suresh
Solved! Go to Solution.
Labels:
- Labels:
-
real user monitoring classic
3 REPLIES 3
Options
- Mark as New
- Subscribe to RSS Feed
- Permalink
15 May 2020 12:39 PM
Dear @Suresh K.
you find details of how these metrics are calculated here: https://www.dynatrace.com/support/help/shortlink/user-action-metrics#milestone-metrics
In general, we use the browser's resource timings to report these metric back to Dynatrace, therefore when DOM interactive happens isn't decided by any algorithm of ours but by the browser.
When you also want to include these XHR requests then its probably best to look at other available metrics and whether they would cover your needs
hope that helps.
regards
Thomas
Reply
Options
- Mark as New
- Subscribe to RSS Feed
- Permalink
18 May 2020 08:27 AM
Thanks @Thomas Z.
I our case visually complete is the best fit as these calls get completed within VC time.
Options
- Mark as New
- Subscribe to RSS Feed
- Permalink
18 May 2020 09:30 AM
Hi Suresh,
I don't use DOM interactive, as it is unreliable in my point of view. "Visually Complete" is
a better metric. But there is no one metric that suits it all. You should test what's better in your case, and as Thomas said, Dynatrace gets these values from the browser. If there are doubts about what is happening in your applications, I would suggest getting even more detail from the "Developers Tool" in your browser.
Antonio Sousa
Featured Posts
