- Dynatrace Community
- Ask
- Real User Monitoring
- Re: Dynatrace High CPU consumption
- Subscribe to RSS Feed
- Mark Topic as New
- Mark Topic as Read
- Pin this Topic for Current User
- Printer Friendly Page
- Mark as New
- Subscribe to RSS Feed
- Permalink
19 Jan 2023 10:55 PM
Hello
we have Dynatrace installed on Siebel Webservers(Linux) and we have seen around 20% of the CPU consumption increment after the Dynatrace enabled for RUM, has anyone has seen this issue ? and anything can be for optimization?
Regards
Sachin
Solved! Go to Solution.
- Mark as New
- Subscribe to RSS Feed
- Permalink
19 Jan 2023 11:01 PM
Not related to Siebel in particular but the only times I have seen high CPU utilisation in my linux servers is when Trend/McAfee security software causes really high cpu util.
Could be completely unrelated to your situation but worth knowing that those sort of inspection type software can introduce issues. If you have a test box try turning these off if you have them.
Which process is increasing? Dynatrace it self or one of the other processes?
- Mark as New
- Subscribe to RSS Feed
- Permalink
19 Jan 2023 11:04 PM
Apache Webserver CPU consumption is going high, lets say without DT its consuming 30% on peak load but with DT it is reaching more than 50%
Thanks
- Mark as New
- Subscribe to RSS Feed
- Permalink
20 Jan 2023 12:52 AM
@SachinJindal I found a thread from a while ago seems like 3-5% is acceptable, and only the network module is able to throttle.
https://community.dynatrace.com/t5/Dynatrace-Open-Q-A/Dynatrace-Agents-Overhead/m-p/51071
I would open a support ticket with a diagnostic dump. https://dt-url.net/lb626l9 unless someone comes back with issues explicitly with Apache.
Out of curiosity what sort of request throughput are you having on this service? and whats the version and Process technology name?

- Mark as New
- Subscribe to RSS Feed
- Permalink
20 Jan 2023 05:25 AM
Hi,
I could see CPU is getting high on AG server, one of the service is consuming more CPU on the server.
What could be Exact reason behind this CPU high utilisation and where should I look for the RCA for this issue
On console I can see only CPU usage but not able to find out the reason behind it ?
Plz suggest
- Mark as New
- Subscribe to RSS Feed
- Permalink
20 Jan 2023 07:17 AM
@SachinJindal If there is not a high CPU related to oneagents processes (oneagentos, extensions, etc..) I recommend disabling RUM on the webserver process groups to check if the CPU drops. If it's RUM then is more about diagnosing the issue there - could be related to some specific setting such as injection rules (if you have them). Do you have also log enrichment enabled? Definitely 20% increase seems too high. What is the traffic?
- Mark as New
- Subscribe to RSS Feed
- Permalink
20 Jan 2023 01:49 PM
Hello @Julius_Loman if we disable RUM than more likely we are only doing infra monitoring which works perfectly as well. also tried couple of apache setting disabled in Dynatrace monitoring time queueing etc , as soon as i will disable httpd deep monitoring it comes back to normal CPU.
- Mark as New
- Subscribe to RSS Feed
- Permalink
20 Jan 2023 02:59 PM
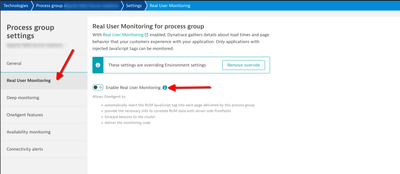
Now it's about finding your why it's such overhead. Keep deep monitoring and disable just RUM sensor by turning off RUM on the process group level.
- Mark as New
- Subscribe to RSS Feed
- Permalink
20 Jan 2023 03:16 PM
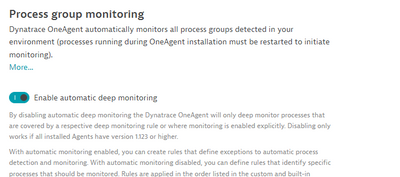
on process group i can only see below option.
- Mark as New
- Subscribe to RSS Feed
- Permalink
20 Jan 2023 03:18 PM
The following toggle:
- Mark as New
- Subscribe to RSS Feed
- Permalink
20 Jan 2023 03:56 PM
Thanks , This test case we already tried and disabling RUM it comes back to normal CPU.
- Mark as New
- Subscribe to RSS Feed
- Permalink
21 Jan 2023 07:26 PM
@SachinJindal OK, then this is caused by the RUM sensor. I'd try defining injection rules to put the Dynatrace RUM only on the subset of pages and see how much the CPU usage increases. Without knowing your load it's difficult to say what is causing the issue. Maybe RUM sensor is injecting also into responses where it's not necessary or desired. Also in parallel to get this resolved - open a support ticket or use the built-in product chat for assistance.
- Mark as New
- Subscribe to RSS Feed
- Permalink
21 Jan 2023 08:32 PM
Thanks for the suggestion and provided the perf tool stats to support team for analysis.
- Mark as New
- Subscribe to RSS Feed
- Permalink
22 Jul 2025 04:02 AM
I am exploring High CPU Consumption in live dynatrace web:
I see that webserver consumes high CPU but it is not Apache. Could you conclude what is webserver process then?
Featured Posts


