- Dynatrace Community
- Ask
- Real User Monitoring
- Re: How to calculate Percentage of the Apdex "Frustrated" user's per Application?
- Subscribe to RSS Feed
- Mark Topic as New
- Mark Topic as Read
- Pin this Topic for Current User
- Printer Friendly Page
- Mark as New
- Subscribe to RSS Feed
- Permalink
14 Apr 2022 02:13 PM
I am trying to create a visual chart using a Honeycomb to plot the percentage of Frustrated users per Application. The idea is to provide a visual for drill down.
I was using Data Explorer and dividing the Frustrated user's by the overall total. Since I cannot use nested SQL, the below is not calculating properly and seems to mix the applications in the division. (I believe because of the sorting). Any ideas or other ways of doing this?
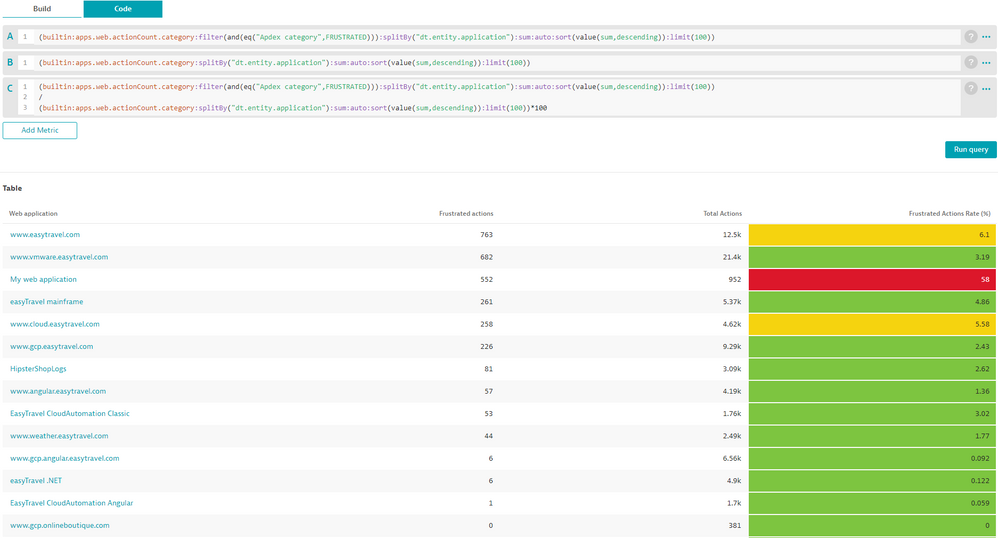
(builtin:apps.web.actionCount.category:filter(and(eq("Apdex category",FRUSTRATED))):splitBy("dt.entity.application"):sum:auto:sort(value(sum,descending)):limit(100))
/
(builtin:apps.web.actionCount.category:splitBy("dt.entity.application"):sum:auto:sort(value(sum,descending)):limit(100))
Solved! Go to Solution.
- Labels:
-
user sessions
-
usql
- Mark as New
- Subscribe to RSS Feed
- Permalink
14 Apr 2022 02:37 PM
Hi @jmackey ,
The metric you are using actually provides you the number of "frustrated"- rated user actions per application. You can calculate the rate using the metric expression that you have, for clarity purposes I'd advise to split it in 3 metrics, one for Frustrated user actions per application, another for Total user actions per application and finally another one for Frustrated user action rate per application. An example below:
Hope this is useful for you!
- Mark as New
- Subscribe to RSS Feed
- Permalink
14 Apr 2022 03:24 PM
Thank you Luislira that worked. I think the reason it did not work originally is I had the "Fold Transformation" set to Sum.
So I'll push my luck with a follow up question. Is there a way to compare this to the average "Frustrated" metric for an Application? Then I go show an alert when it exceeds the normal for the application.
- Mark as New
- Subscribe to RSS Feed
- Permalink
14 Apr 2022 04:12 PM - edited 14 Apr 2022 04:12 PM
Awesome it worked!
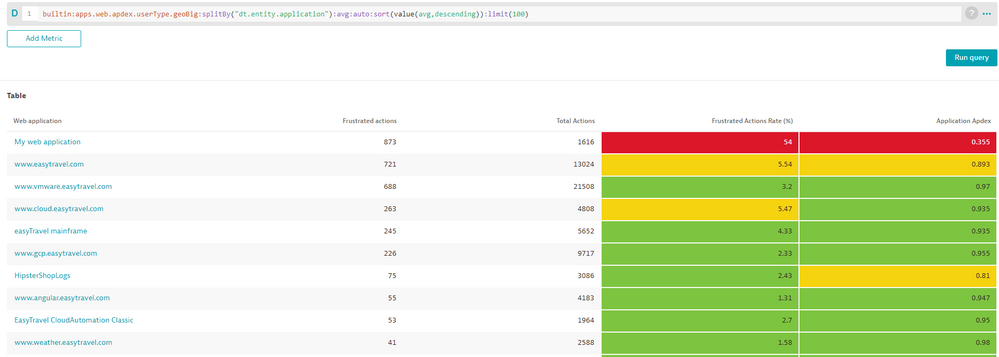
For the Average "Frustrated" metric by application, you can use this metric for example:
builtin:apps.web.apdex.userType.geoBig
and then split by Web Application. I would suggest for a quick and manual comparison to add it as a 4th row in the previous table with your own thresholds set like this:
If you want to alert on the overall Apdex for an application you can set a Custom alert for this metric under Settings > Anomaly Detection > Custom Events for Alerting and create your alert based on a certain Apdex threshold.
Featured Posts


