- Dynatrace Community
- Ask
- Real User Monitoring
- Re: How to chart the count of a given key user action split by Apdex categories?
- Subscribe to RSS Feed
- Mark Topic as New
- Mark Topic as Read
- Pin this Topic for Current User
- Printer Friendly Page
- Mark as New
- Subscribe to RSS Feed
- Permalink
25 Aug 2020
12:52 PM
- last edited on
30 Sep 2022
12:06 PM
by
![]() MaciejNeumann
MaciejNeumann
Hi,
I am having a problem with chart count of key user actions and corresponding Apdex categories.
I want to chart the count of a given key user action in a stacked bar split by Apdex categories.
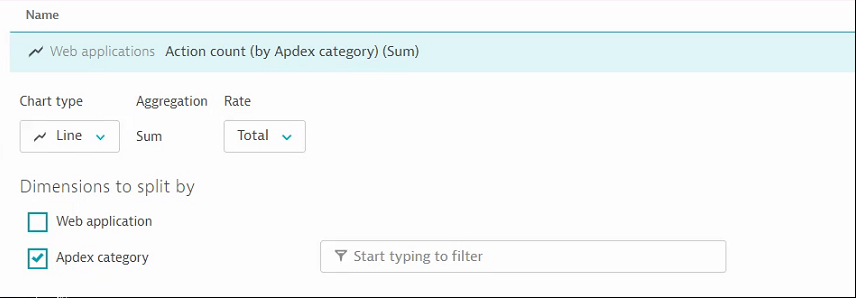
When I add this metric "Action count by Apdex category" I can see the breakdown of each Apdex category however I cannot filter per specific key user action.

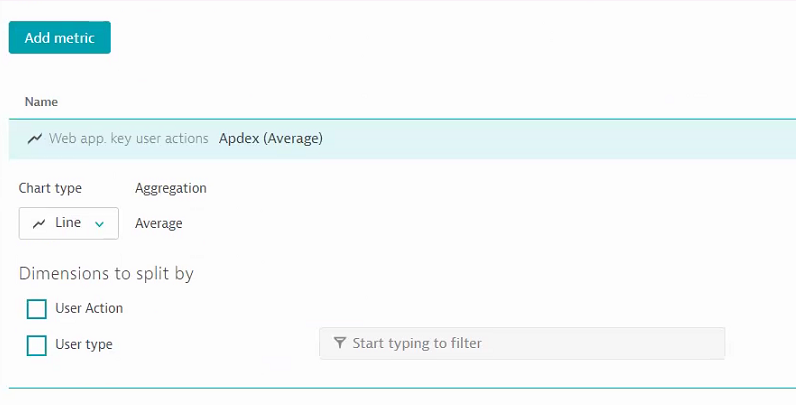
And with the metric "Apdex for Key user actions" I can filter for specific key user action but I cannot chart the Apdex categories. It only allows for average Apdex value.

Is there a way to chart the count of a given key user action split by Apdex categories?
Thank you,
Martin
Solved! Go to Solution.
- Labels:
-
user actions
- Mark as New
- Subscribe to RSS Feed
- Permalink
25 Aug 2020 04:48 PM
Hey Martin,
sadly you are right and this is currently not possible.
what we hopefully soon release (planned in 2-3 sprints, after a short test phase) is the ability to also use the Apdex in the MDA. Meaning you can also use it to create a calculated metric based on it. And since you can already use any user action as a filter you would end up with apdex ratings, split by Apdex categories for one specific user action.
The created calculated metric can then be used and visualized in custom charting, where you can select "count" instead of "sum" for the aggregation, which will give you pretty much what you asked for. For example, a pie chart containing the counts for the Apdex categories for a given user action.
PS: I will update this as soon as we release it!
regards
Thomas
- Mark as New
- Subscribe to RSS Feed
- Permalink
26 Aug 2020 09:43 AM
Thank you, Thomas.
Will be waiting for the update.
- Mark as New
- Subscribe to RSS Feed
- Permalink
26 Aug 2020 03:08 PM
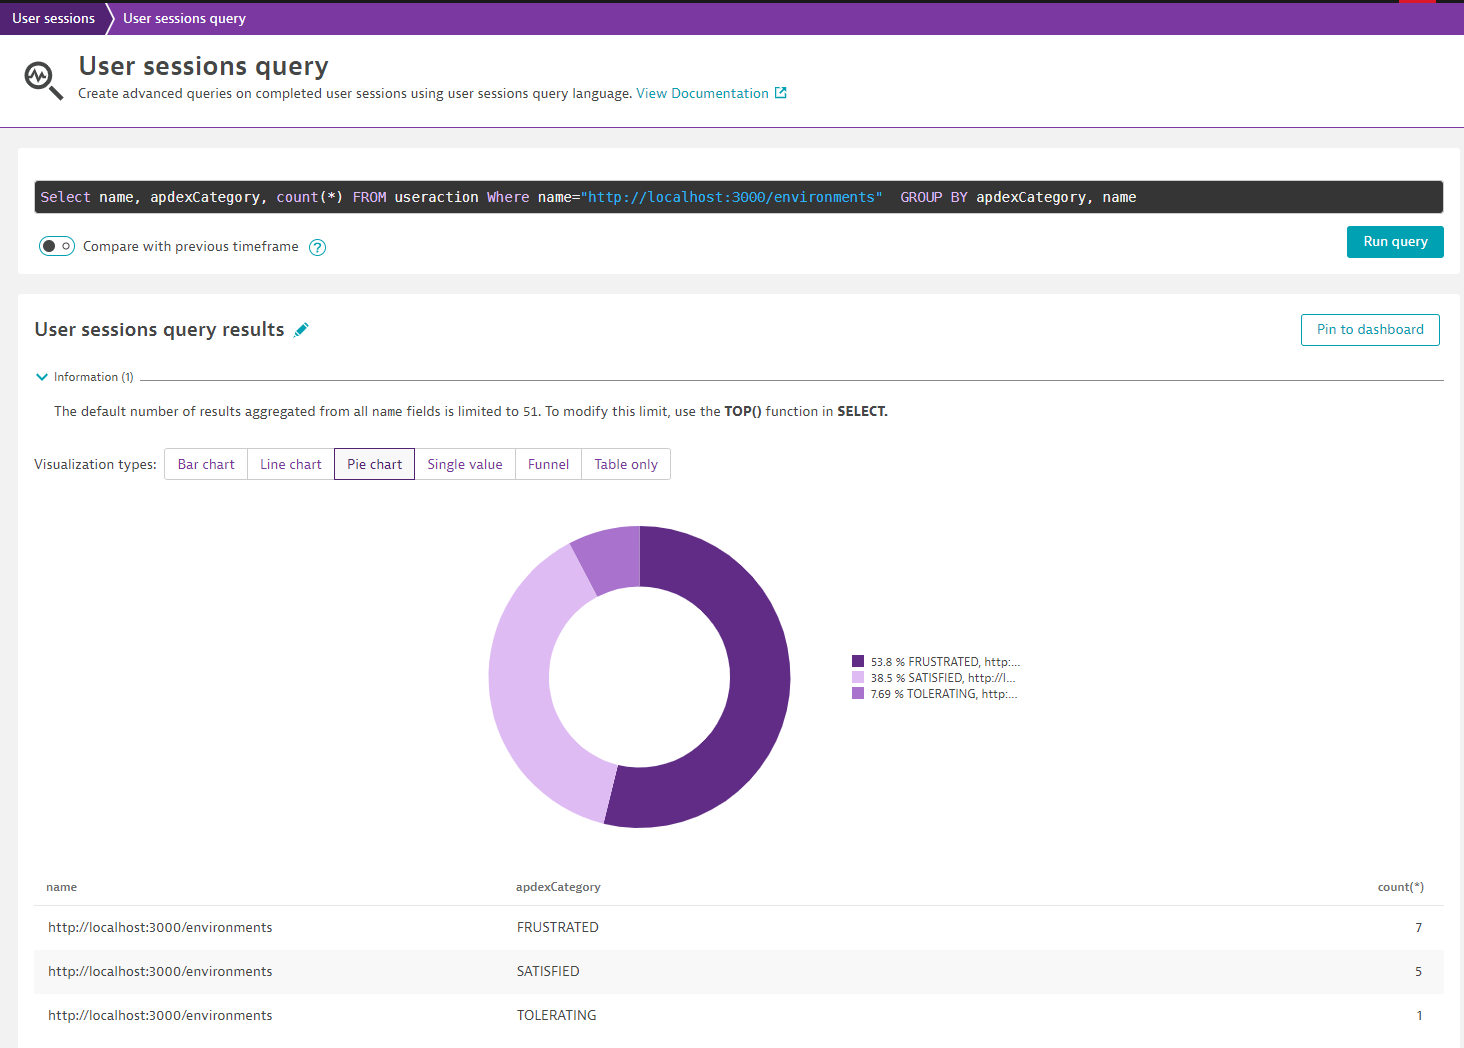
If it's only for one Key User Action maybe you could use a USQL like this as a workaround till then:

- Mark as New
- Subscribe to RSS Feed
- Permalink
16 Oct 2020 07:07 AM
Thanks, Patrick!
- Mark as New
- Subscribe to RSS Feed
- Permalink
16 Oct 2020 07:07 AM
Thomas, Is this feature going to be released soon?
Thanks,
Martin
Featured Posts
