This website uses Cookies. Click Accept to agree to our website's cookie use as described in our Privacy Policy. Click Preferences to customize your cookie settings.
Real User Monitoring
User session monitoring, key user actions - everything RUM.
Turn on suggestions
Auto-suggest helps you quickly narrow down your search results by suggesting possible matches as you type.
- Community Home
- Platform
- Real User Monitoring
- Re: I can't find a way to get the Tomcat threads to show up on my Tomcat processes - any thoughts?
Options
- Subscribe to RSS Feed
- Mark Topic as New
- Mark Topic as Read
- Pin this Topic for Current User
- Printer Friendly Page
Options
- Mark as New
- Subscribe to RSS Feed
- Permalink
17 Dec 2019
01:22 PM
- last edited on
27 Apr 2021
12:11 PM
by
![]() MaciejNeumann
MaciejNeumann
Hi,
So i've been trying to get the Tomcat threads to show up under my 'Further details' on my processes which are Tomcat in my environment. So far i have been unsuccessful. It's weird because for the Spring apps, it shows up no problem.
I do report full JMX stats and see those on the Process, so clearly i can get what i need, I'm wondering if i just need a further configuration. I tried making custom metrics but that was shaky at best and i never really got quite what i needed, and in speaking with Support the indications is should see what i need by default, yet i do not.
My suspicion is that the way we have utilized jakarta-tomcat is doing something funky with Dynatrace and causing those stats to not report properly, despite us having that info in *ewRelic. Anyone who could suggest something, it would be greatly appreciated. I've run out of ideas and paths to investigate.
Solved! Go to Solution.
Labels:
- Labels:
-
apache
-
application monitoring
7 REPLIES 7
Options
- Mark as New
- Subscribe to RSS Feed
- Permalink
17 Dec 2019 01:51 PM
So you say that you can create JMX plugin that will fetch those metrics for you? I've seen multiple times that some thread pools had wrong data scale (for example values was not 100 but 1 when it should be 100) but I've never seen situation where thread-pools are missing at all.
Sebastian
Regards, Sebastian
Options
- Mark as New
- Subscribe to RSS Feed
- Permalink
17 Dec 2019 01:54 PM
yeah so i mad a plugin and you are correct, the scale is all wrong (i see 2.0 or 1.5 but on the Tomcat Process in the box i know it has something like 172) so i gave up on that.
It's really weird because i DO see Tomcat threads reporting on my Spring apps like i would expect (see screenshot) which makes me believe it's config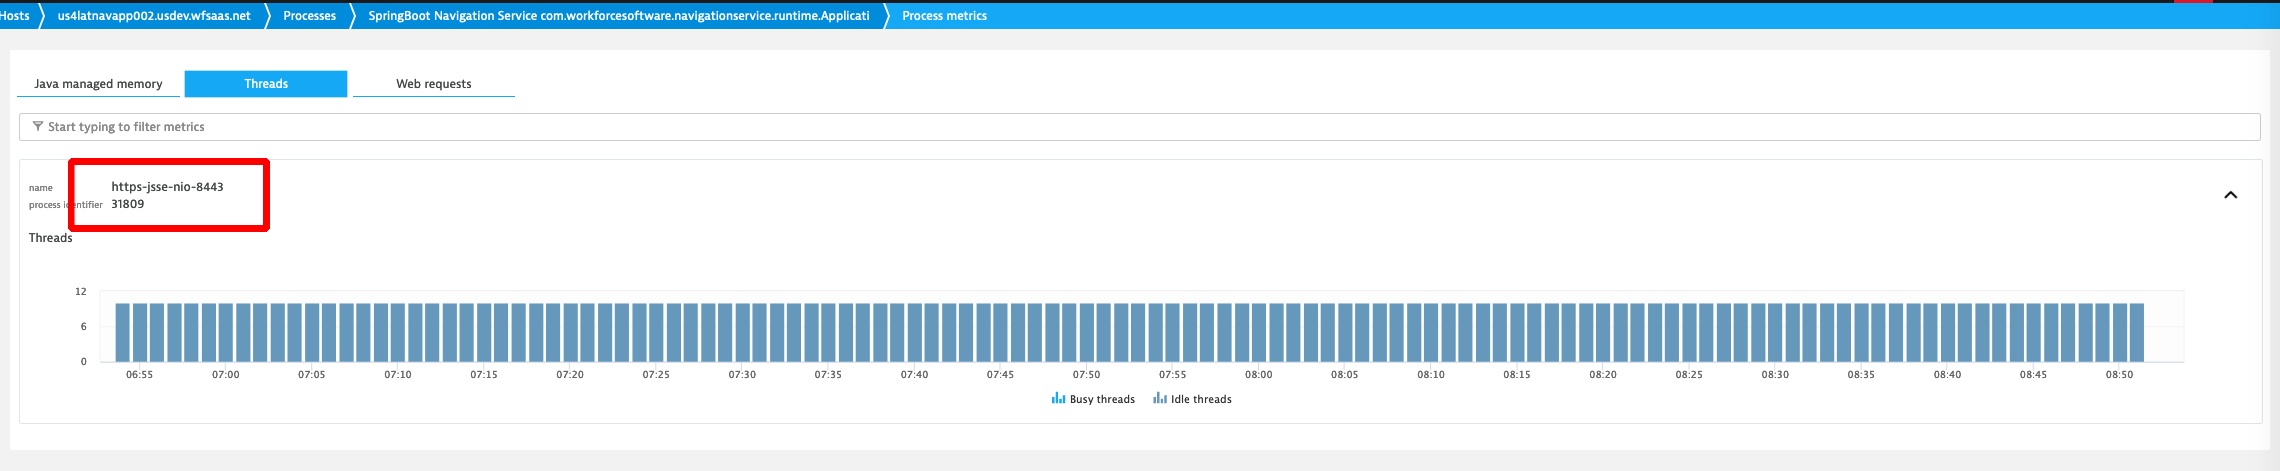
Options
- Mark as New
- Subscribe to RSS Feed
- Permalink
17 Dec 2019 02:09 PM
I think this may need assistance someone from stuff or support ticket. In general on process tab you see total amount of threads started by process, here you have internal thread pool related to technology.
Sebastian
Regards, Sebastian
Reply
Options
- Mark as New
- Subscribe to RSS Feed
- Permalink
17 Dec 2019 03:49 PM
thanks, i figured it would. got a ticket open with them.
Reply
Options
- Mark as New
- Subscribe to RSS Feed
- Permalink
19 Dec 2019 08:46 AM
We do get threads counts in the process details for Tomcats (with recent OneAgents). I believe this is something wrong happening in your environment.
Also a significant improvement regarding threads in Java came with 175 (Oneagent) / 176 (Cluster) - Continuous thread analysis. But this is more or less a debug functionality, but very useful for troubleshooting the applications.
Dynatrace Ambassador | Alanata a.s., Slovakia, Dynatrace Master Partner
Options
- Mark as New
- Subscribe to RSS Feed
- Permalink
19 Dec 2019 02:40 PM
I've suspected it was something on our side. We do some funky JAva mambo in our app so it doesn't surprise me that it might not be a DT Config/function issue.
Options
- Mark as New
- Subscribe to RSS Feed
- Permalink
19 Dec 2019 02:57 PM
Well, still it might be a bug of OneAgent. I remember some issues happening in Tomcats such as not injecting Dynatrace Javascript agent into web applications.
If it is possible, try to update the OneAgent to the most recent available version for the host and restart the processes.
Dynatrace Ambassador | Alanata a.s., Slovakia, Dynatrace Master Partner
Featured Posts
