- Dynatrace Community
- Ask
- Real User Monitoring
- RUM not capturing correct Largest Contentful Paint
- Subscribe to RSS Feed
- Mark Topic as New
- Mark Topic as Read
- Pin this Topic for Current User
- Printer Friendly Page
- Mark as New
- Subscribe to RSS Feed
- Permalink
27 Sep 2022
02:50 PM
- last edited on
27 Sep 2022
03:17 PM
by
![]() Ana_Kuzmenchuk
Ana_Kuzmenchuk
Hi,
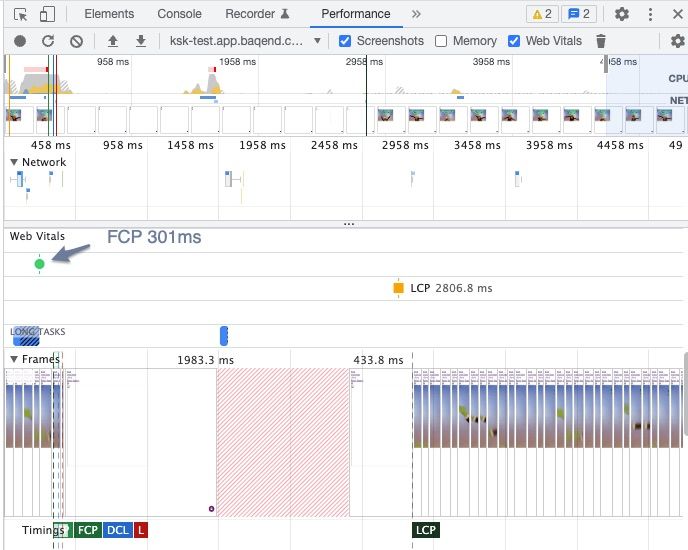
I'm testing out the Web Vitals monitoring capabilities and have created a (somewhat naive) test page for this. What surprises me is the fact that the DT RUM keeps reporting very fast LCPs although I'm specifically delaying the rendering of the LCP image element, and Chrome Dev Tools does indeed tell me the LCP is beyond the 2500ms I'm enforcing through a simple JS timer.
I assume the problem lies in the beacon being sent way before the page is finished and the LCP cannot be captured correctly. Is there a setting I've missed to ensure the correct timer to be used?
An example of a test url is: https://ksk-test.app.baqend.com/v1/file/www/dt_test_image_medium.html?pause=2500
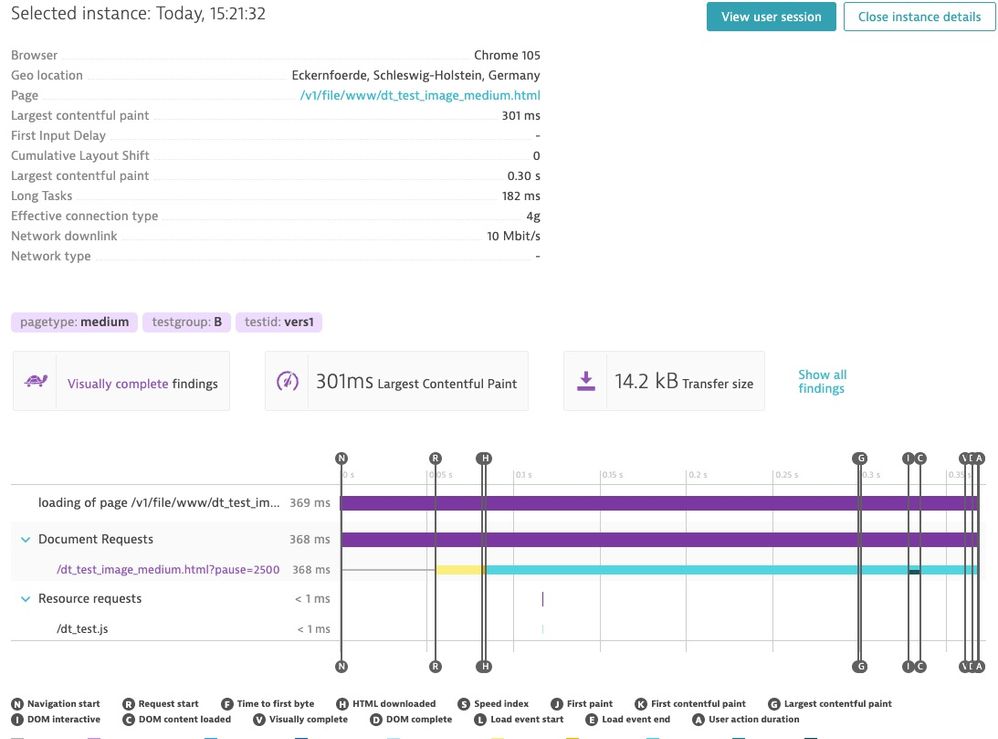
I've attached the screenshots of a particular page navigation which clearly shows the LCP reported by Chrome was at 2.8s while RUM reports 301ms - which is the same as the FCP.
Solved! Go to Solution.
- Labels:
-
real user monitoring classic
- Mark as New
- Subscribe to RSS Feed
- Permalink
27 Sep 2022 02:55 PM
Hi @kskoeld,
If it is true it would be a product bug I guess. I have not checked the DT LCP results on browser side, I thought this is a single source of truth 😉. I am going to check it on my side also.
Are you from Speedkit? (based on the baqend.com domain)
Br Mizső
- Mark as New
- Subscribe to RSS Feed
- Permalink
27 Sep 2022 04:50 PM
Hi @kskoeld,
Maybe you have found a real product bug. I have already checked the LCP metrics in the DT and the Chrome dev tool (on speedkit.com 😆) and they were not match. Maybe we have to raies a support ticket regarding this in order to get an explanation regarding the differences.
Chrome dev always gave back higher LCP than 1000ms for speedkit.com. In DT I tested it from two synthetic location: from Frankurt AWS (my favourite one) and form Sao Paulo (accindently was choosen different from Germany, I guess speedkit HQ is in Germany) See attached the results. Sometimes the max. LCP reach 1000ms in Sao Paulo, but from Frankfurt the highest metric value was around 650ms...
So it is strange, I hope I did not make any missconfiguration.
We are using DT to represent the perfromance issues for the customers and it is important for us to show precise values.
Greetings for the Speed Kit Team: Fadi, Tibor and Thies. 😉
Br, Mizső
- Mark as New
- Subscribe to RSS Feed
- Permalink
29 Sep 2022 01:32 AM - edited 29 Sep 2022 01:34 AM
Hi @Mizső
I guess my last reply got lost when the duplicate thread I posted accidentally under synthetic was deleted. Oh well.
But to add some more information to the problem:
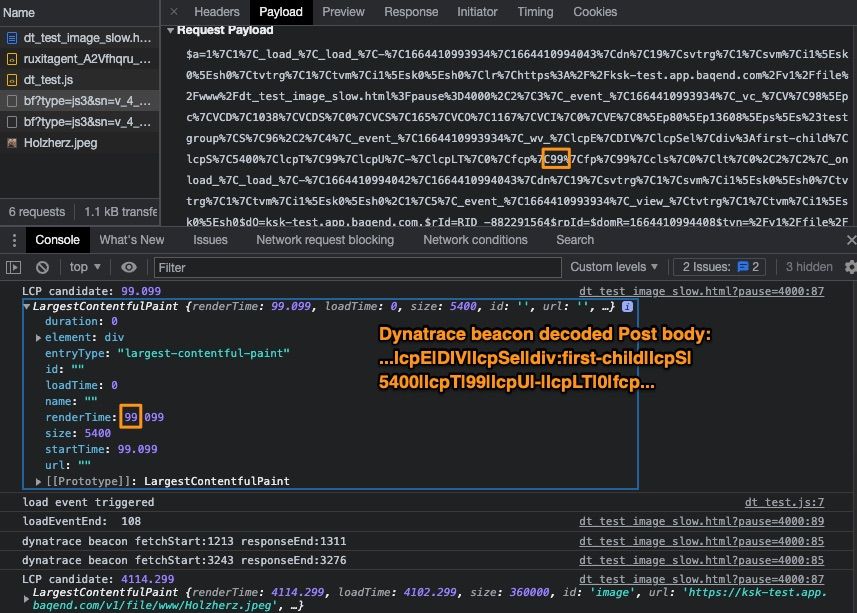
The issues seems to be that as I assumed the DT beacon is simply sent too early.
Since LCP keeps updating when the page continues rendering any monitoring tool needs to wait until the user has interacted with the page (since then LCP performanceEntries will no longer be dispatched) and of course always use the last of the entries.
However in this particular case the beacon is sent way to early (possibly 1s after load event?) so it cannot even capture the later LCP dispatches.
Question is, whether it is possible to either delay the beacon or to send another beacon as it should be done to actually measure the right LCP.
I wouldn't necessarily call this a bug, since sending the beacon say after 1s delay after load typically is fine and you don't want to wait too long and possibly lose all the information.
But I'm sure there is some option to send the data later - even if it costs additional beacons.
Otherwise any lazy loading of LCP elements might never be captured (not saying anyone should do such a thing - don't lazy load ATF).
I've added some code to track the various timings in the console.
- Mark as New
- Subscribe to RSS Feed
- Permalink
29 Sep 2022 05:50 AM
Hi @kskoeld
Thanks for the further investigation. I am going to pass it to the support in order to ask for them a comment.
Best regards,
Mizső
- Mark as New
- Subscribe to RSS Feed
- Permalink
29 Sep 2022 10:18 PM
Granted this is a really weirdly constructed edge case and using the setTimeout was the reason why DT did not capture the data correctly.
I found the corresponding configurations in the Content Capture section of the web application settings.
The "Extend action durations with cascading time actions" allows to wait for max 1000ms per timeout.
And the "Visually complete and Speed Index" has the "inactivity timeout for load actions" - by default 1000ms.
Since in my case the load event fires very quickly the beacon is then sent ~1000ms after that event.
And since I didn't use cascading timeouts again only a 1000ms threshold was used.
Hence beacon was always fired too early for my test scenario.
I fixed that by using cascading intervals and actually completely blocking the main thread additionally if my 3*1000ms wasn't enough (painful, but there you go).
So again, in probably most cases the LCP is measured correctly.
I would still like to know whether it would be possible to have DT capture the LCP not in the "load" beacon (for lack of better term) but instead whenever the user interacts with the page as it is done web-vitals JavaScript Library with onLCP
- Mark as New
- Subscribe to RSS Feed
- Permalink
29 Sep 2022 10:58 PM
Hi @kskoeld,
Thanks for sharing this useful information. I have already raised the support ticket. I have included this community chat, so I hope they will read your last sentences... 😉
Br, Mizső
- Mark as New
- Subscribe to RSS Feed
- Permalink
14 Dec 2022 02:58 PM
Hi @Mizső! How has the case with this support ticket gone eventually? 😊
- Mark as New
- Subscribe to RSS Feed
- Permalink
14 Dec 2022 09:57 PM
Hi @Michal_Gebacki,
This was the Support answer:
"Thanks a lot for contacting support. I will be assisting you on this ticket.
Regarding you question:
we only capture the lcp value until the load action finished, while lcp can potentially continue to grow.
That's why it is different."
Best regards,
Mizső
- Mark as New
- Subscribe to RSS Feed
- Permalink
25 Jan 2023 07:56 PM
Hi @Mizső do you have any new answer from support team? 😃
Thanks in advance!
- Mark as New
- Subscribe to RSS Feed
- Permalink
26 Jan 2023 02:54 PM
Hi @AndresGarciaO,
My previous psot was the latest one. Support ticket has been closed.
Best regards,
Mizső
Featured Posts


