- Dynatrace Community
- Ask
- Real User Monitoring
- Re: Real user experience in time
- Subscribe to RSS Feed
- Mark Topic as New
- Mark Topic as Read
- Pin this Topic for Current User
- Printer Friendly Page
- Mark as New
- Subscribe to RSS Feed
- Permalink
18 Apr 2022 03:02 PM
Is it possible to calculate the time spent by a real user on every screen or event of an entire end-to-end flow on a website? We have a requirement to be fulfilled and want to check if Dynatrace is a perfect fit for that.
Scenario:
We want to report the user experience on a application. So for example, if a particular user takes 25 minutes to complete a flow and in order to do that he has to load a screen 10 times within 12minutes to get to the result. Maybe another user can take 22minutes to do so.
So is it possible to pull out the average of these values for each unique real user directly through Dynatrace?
Any help on this would be appreciated.
Thank you.
Solved! Go to Solution.
- Mark as New
- Subscribe to RSS Feed
- Permalink
18 Apr 2022 04:21 PM
Dynatrace focuses on user actions and does not measure the "think time" - the time user spends on a webpage without interacting with it. However, it can be measured using custom actions by calling the Dynatrace JS API. For example to measure the time the user fills out a form on a page.
If you just need an overall number, then probably the average duration of a user session is what you are looking for.
- Mark as New
- Subscribe to RSS Feed
- Permalink
18 Apr 2022 07:37 PM
Thanks @Julius_Loman .
This takes me to my next question. Can we use this Dynatrace JS API to find out the amount of time taken by the user on each and every webpage while navigating through one flow?
- Mark as New
- Subscribe to RSS Feed
- Permalink
18 Apr 2022 08:57 PM
@GauriS the RUM JS API is used for reporting user actions and other data to Dynatrace, not for querying for data.
My idea here is to start a new custom action as soon as user starts an activity that you need to measure and it's not captured by Dynatrace automatically. For example entering data to a form.
Maybe you should also have a look on this thread.
- Mark as New
- Subscribe to RSS Feed
- Permalink
25 Apr 2022 08:34 PM
Hello @Julius_Loman ,
Is it possible to understand how users experience a website, both from visual and responsiveness standpoints through Dynatrace?
Thank you.
- Mark as New
- Subscribe to RSS Feed
- Permalink
26 Apr 2022 07:41 AM
Sure it is. For visual standpoint, it's best to engage the session replay feature. If you do not use session replay for any reason, you can rely on the detected and reported errors (request errors, js errors) which indicate visual and functional issues with your web app. Both visual and functional attributes are combined in Apdex rating. So overall it's recommended to focus on the Apdex and if the apdex is not in acceptable range, you can drill down to root causes in Dynatrace data.
For responsiveness, you already have many metrics for your user sessions and actions such as core web vitals, visually complete
- Mark as New
- Subscribe to RSS Feed
- Permalink
27 Apr 2022 09:22 PM
HI @Julius_Loman,
Based on all the information provided on this thread, I would like to know whether is it possible to derive a value through any metrics to know the total number of times the user chooses to hit a button on a page via Dynatrace?
Example:
Is it possible to know how many times a user chooses to hit renew button from the search results page via Dynatrace?
Thank you.
- Mark as New
- Subscribe to RSS Feed
- Permalink
28 Apr 2022 07:56 AM
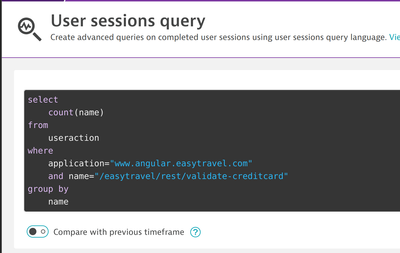
@GauriS sure. I assume when the user hits the button a user action is triggered. So basically you just count the number of the user actions. These can be accomplished by different means:
Either using USQL (Query User Sessions menu):
Keep in mind the USQL works only on closed sessions and does not include data from live sessions. So if your timeframe is recent (e.g. last hour) you might not have accurate answers since there probably will be live sessions for your app.
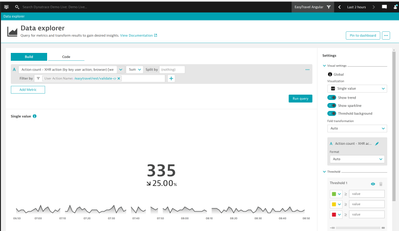
Other option is to use the metric - If you mark your user action as "Key user action", metrics for the user action are created automatically and one of those is builtin:apps.web.action.count.xhr.browser which will give you number of XHR key user actions (there is also separate one for Load actions).
This metric is calculated in continuously and will report you also data from live sessions.
You can also define your own metric with additional filters and splittings.
Featured Posts


