- Dynatrace Community
- Ask
- Synthetic Monitoring
- Re: Metric for HTTP Monitor "Failed Requests"
- Subscribe to RSS Feed
- Mark Topic as New
- Mark Topic as Read
- Pin this Topic for Current User
- Printer Friendly Page
- Mark as New
- Subscribe to RSS Feed
- Permalink
19 Jan 2023 10:03 PM
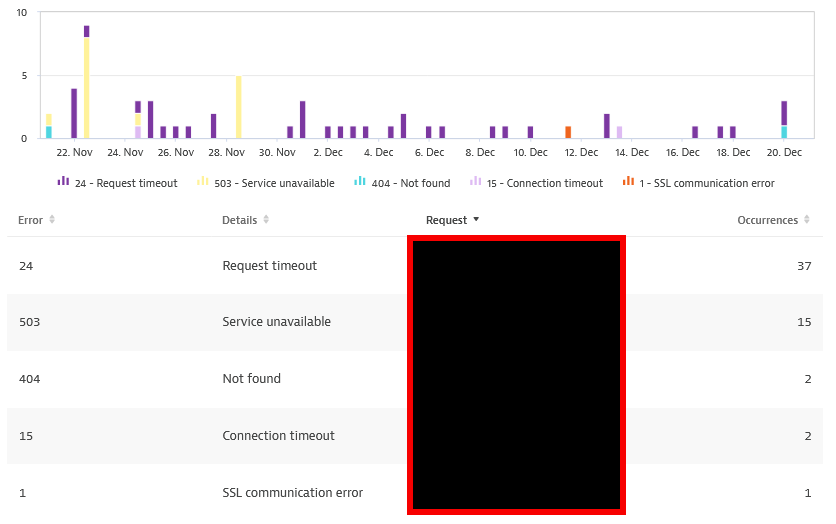
When navigating in the HTTP Monitor UI, one of the most useful graphs for me is the Failed Requests:
It seems to me that these values are not available in Data Explorer, so I can create a dashboard tile with it. Before I post a Product Idea for this, does anyone have an idea if I might be missing something that seems should be available?
Solved! Go to Solution.
- Labels:
-
http monitor
-
synthetic monitoring
- Mark as New
- Subscribe to RSS Feed
- Permalink
19 Jan 2023 10:53 PM
@AntonioSousa
the closest metric I can find is as below
Status code count (by request, location) [HTTP monitor]
builtin:synthetic.http.request.statusCode
builtin:synthetic.http.request.statusCode:splitBy("Status code","dt.entity.http_check_step"):sort(value(auto,descending)):limit(20)
But its no where near as granular as what you are showing, only shows major error class i.e 2xx and doesn't provide the error details.
Could I get instructions on how you got to that page in your screen shot? I have had issues in the past where the UI has exactly what I need, data wise, but the built in metrics exposed to us do not provide them. I have had to create custom metrics to achieve dash-boarding for what the gui is showing.
- Mark as New
- Subscribe to RSS Feed
- Permalink
21 Jan 2023 03:39 PM
Thanks for your input. I also use the metric that you refer to, but the total ammount of failures is bigger than the values given by builtin:synthetic.http.request.statusCode
This is because it doesn't count failures that happen before an HTTP response might happen (DNS problems, connection problems, timeouts, etc.)
I have also put a Product Idea for this, so it can be upvoted: https://community.dynatrace.com/t5/Dynatrace-product-ideas/Metric-for-HTTP-Monitor-quot-Failed-Reque...
- Mark as New
- Subscribe to RSS Feed
- Permalink
20 Jan 2023 05:46 AM
Please also try builtin:synthetic.http.request.resultStatus. It gives a count of requests which you can split by success or failure (result status).
- Mark as New
- Subscribe to RSS Feed
- Permalink
21 Jan 2023 03:32 PM - edited 21 Jan 2023 03:37 PM
Yes, I use that metric, but unfortunately we cannot split failures for the type of errors.
I have put a Product Idea for this, so it can be upvoted: https://community.dynatrace.com/t5/Dynatrace-product-ideas/Metric-for-HTTP-Monitor-quot-Failed-Reque...
- Mark as New
- Subscribe to RSS Feed
- Permalink
23 Jan 2023 09:01 AM
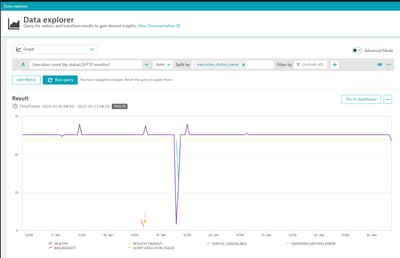
I usually use builtin:synthetic.http.execution.status:splitBy(execution_status_name) for that as it shows all the statuses.
Featured Posts


