- Dynatrace Community
- Ask
- Synthetic Monitoring
- Re: No option available to import synthetic monitoring information. Am I missing something?
- Subscribe to RSS Feed
- Mark Topic as New
- Mark Topic as Read
- Pin this Topic for Current User
- Printer Friendly Page
- Mark as New
- Subscribe to RSS Feed
- Permalink
20 Jan 2021 06:57 PM
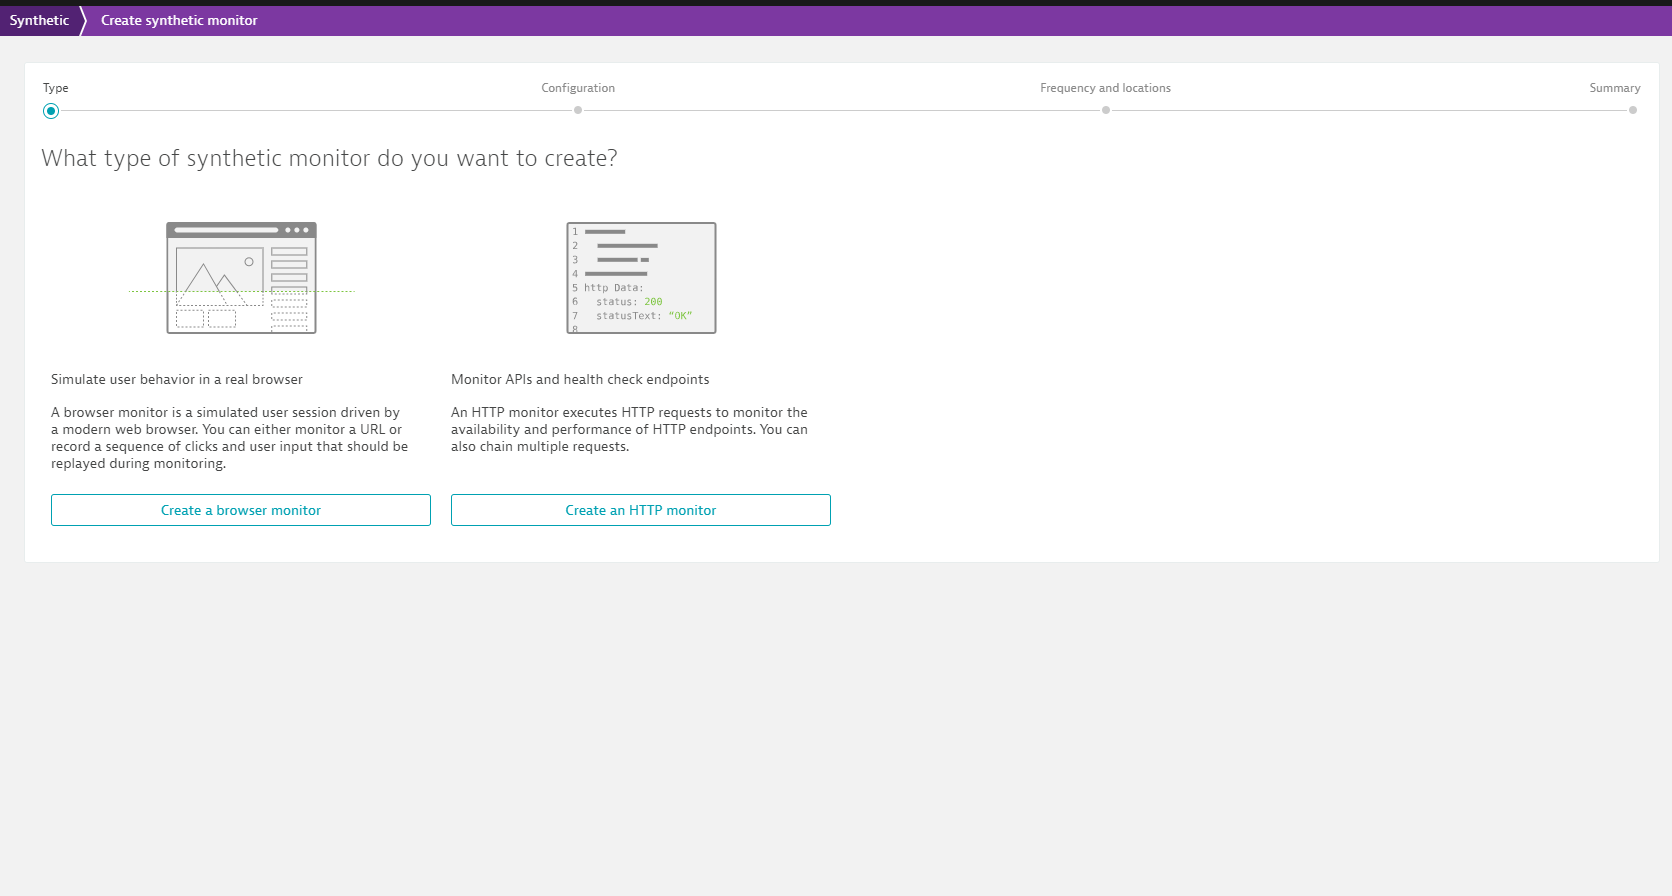
I'm trying to follow this tutorial https://www.dynatrace.com/news/blog/explore-and-analyze-amazon-cloudwatch-synthetics-data-in-dynatra... but when I get to the "Then, to begin importing the CloudWatch Synthetics data" step and try to create a synthetic monitor, I don't see any "Explore the Options" link anywhere. This is all I see

Any idea what's going on here?
Thanks in advance!
Solved! Go to Solution.
- Labels:
-
synthetic monitoring
- Mark as New
- Subscribe to RSS Feed
- Permalink
20 Jan 2021 08:17 PM
You can push the data via API:

- Mark as New
- Subscribe to RSS Feed
- Permalink
22 Jan 2021 10:16 AM
Hi Chad
Thanks for the answer - isn't this what the script on github does? (https://github.com/Dynatrace/dynatrace-api/tree/master/third-party-synthetic/aws-cloudwatch)
Having set up the token as per the blog, we're getting a 403 - as per below - so we assumed the step we were missing as per David's original post that we hadn't enabled the synthetics bit -
The error in cloudwatch is
"Posting third-party monitor result failed: 403. "{\"error\":{\"code\":403,\"message\":\"Synthetic is not enabled\"}}" "
The github script hits the: "/api/v1/synthetic/ext/tests " endpoint
Cheers
Chris
- Mark as New
- Subscribe to RSS Feed
- Permalink
25 Jan 2021 03:44 PM
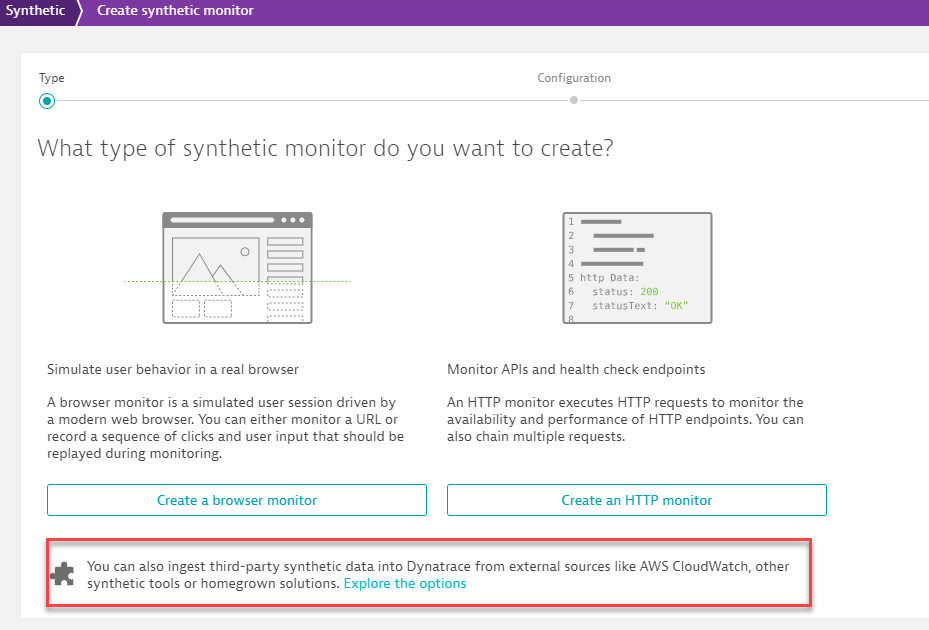
@David F. with the most recent cluster update: 1.209, it appears that there is a section for 3rd party synthetic data now:

If you are managed, the cluster update is about 2 weeks behind SaaS users.
Featured Posts
