This website uses Cookies. Click Accept to agree to our website's cookie use as described in our Privacy Policy. Click Preferences to customize your cookie settings.
Troubleshooting
Articles about how to solve the most common problems
Turn on suggestions
Auto-suggest helps you quickly narrow down your search results by suggesting possible matches as you type.
- Dynatrace Community
- Learn
- Troubleshooting
- Why is JBoss dashboard for WebRequest empty?
Options
- Subscribe to RSS Feed
- Mark as New
- Mark as Read
- Printer Friendly Page
Dynatrace Guide
Options
- Mark as New
- Subscribe to RSS Feed
- Permalink
on 03 Jan 2023 02:41 AM
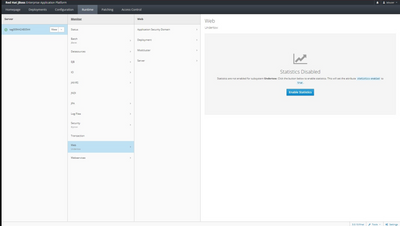
If I go to JBoss process dashboard -> Further Details -> Web Request -> the dashboard is empty.

Root Cause:
By the default, the JBoss EAP has no statistics enabled.
Solution:
The WebRequest Metric can be enabled by the WebGui or Config.
WebGui:

Config:
Example:
<subsystem xmlns="urn:jboss:domain:undertow:7.0" default-server="default-server" default-virtual-host="default-host" default-servlet-container="default" default-security-domain="other" statistics-enabled="true">
Labels:
