- Mark as New
- Subscribe to RSS Feed
- Permalink
21 Sep 2023
11:47 AM
- last edited on
23 Nov 2023
11:02 AM
by
![]() Michal_Gebacki
Michal_Gebacki
Hi,
Is there a metric we have that we can use to show the number of Problems being reported to ServiceNow?
Maybe somehow we can retrieve the Integration that was called for a Problem? Would that help?
I need to display this as a Dashboard in Dynatrace (preferably with the new Dashboards).
Or should I be running a custom extension to query servicenow and push the data to DT as a custom metric?
Let me know if there is another solution for the same.
Thanks,
Vishnu
Solved! Go to Solution.
- Mark as New
- Subscribe to RSS Feed
- Permalink
21 Sep 2023 11:52 AM - edited 21 Sep 2023 12:00 PM
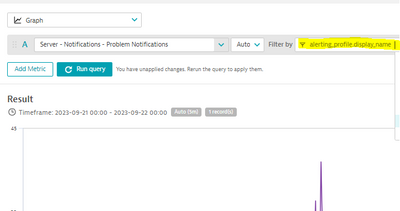
You should be able to use this metric dsfm:server.notifications.problem_notifications.
And then filter by alerting profile and select the one for SNOW. Let me know if that's what you were looking for 🙂
- Mark as New
- Subscribe to RSS Feed
- Permalink
21 Sep 2023 12:24 PM - edited 28 Sep 2023 11:23 AM
Hi,
So this i was able to pin the metric to Classic dashboards.
How do i do the same for the new Dashboards? using Grails, i dont see these metrics in the docs.
fetch events
| filter dsfm
like that, doesnt work...
- Mark as New
- Subscribe to RSS Feed
- Permalink
01 Feb 2024 12:47 PM
anyone can help a Grail query for this?
- Mark as New
- Subscribe to RSS Feed
- Permalink
01 Feb 2024 02:32 PM
Hi,
I think dsfm metric are not in Grail.
Best regards
- Mark as New
- Subscribe to RSS Feed
- Permalink
01 Feb 2024 07:17 PM
Would this help?
fetch events
| filter event.kind == "DAVIS_PROBLEM"
| expand labels.alerting_profile
| filter labels.alerting_profile == "<SNOW_Profile_Name_Here>"


