- Dynatrace Community
- Dynatrace
- Ask
- Container platforms
- Re: Difference between two Kubernetes built-in metrics
- Subscribe to RSS Feed
- Mark Topic as New
- Mark Topic as Read
- Pin this Topic for Current User
- Printer Friendly Page
- Mark as New
- Subscribe to RSS Feed
- Permalink
11 Jul 2022
04:44 PM
- last edited on
11 Jul 2022
08:39 PM
by
![]() Karolina_Linda
Karolina_Linda
Hi everyone,
I have a question about two different but very similar built-in Kubernetes metrics.
At the moment in my environment all the "builtin:cloud.kubernetes.*" metrics have values in them and I can use them and as far as the monitoring of the Kubernetes cluster everything is there and working properly.
But I have noticed the presence of the "builtin:kubernetes.*" metrics which have no value and nothing has ever been written and I don't really understand the difference between these 2 metrics, I didn't find much explanation of what's different on the documentation, the Kubernetes hyperlink takes me to the "builtin:cloud.kubernetes" one but the "builtin:kubernetes" one is also present but I couldn't figure out why just one kind of metrics holds values, does anyone knows why?
Thank you!
Best regards.
Solved! Go to Solution.
- Labels:
-
kubernetes
-
metrics
- Mark as New
- Subscribe to RSS Feed
- Permalink
13 Jul 2022 10:04 AM
"builtin:cloud.kubernetes" - AWS fargate, AZURE cluster, GCP,
"builtin:kubernetes" - VMware tanzu, openshift, other on-prmise kn8s orchestration cluster deployed.
- Mark as New
- Subscribe to RSS Feed
- Permalink
13 Jul 2022 10:17 AM
Sorry but it doesn't seem to be right.
I have checked in the environments of 2 clients, one has clusters on GCP and one has clusters on VMWare and only the "builtin:.cloud.kubernetes" metrics are used in both cases
- Mark as New
- Subscribe to RSS Feed
- Permalink
13 Jul 2022 01:41 PM
Hi Marius,
I have already observed it. Builtin:kubernetes metrics are empty on my side also however I do not have colud integration (AWS,AZURE,GCP) in my environments only have onprem Openshift and OKD integrations. These builtin:kubernetes metrics are listed in the documentation but I could no find any other information about them: Built-in metrics | Dynatrace Docs
As I have checked them I have found a uniqe one especially the frist in the list: builtin:kubernetes.container.oom_kills. This is not exist in builtin:colud.kubernetes.
Maybe I am wrong but once I have seen a perf clininc video with Henrik Rexed. (at 32:10)
Kubernetes managed by Dynatrace Davis - YouTube
He has used an OOM metric on his dashboard, but it can be come from log.kuberenets event also. Maybe he has more info about these mysterious kubernetes metrics.
Br, Mizső
- Mark as New
- Subscribe to RSS Feed
- Permalink
13 Jul 2022 04:57 PM - edited 13 Jul 2022 04:58 PM
Hi everyone,
we are introducing (and deprecating) multiple metrics in the Kubernetes area with the upcoming versions of our product. The metrics starting with builtin:kubernetes, are already a first sign for this. I've just published a community post with lots of details on this here.
Happy to answer any questions on that over there 🙂
Best,
Florian
- Mark as New
- Subscribe to RSS Feed
- Permalink
13 Jul 2022 05:04 PM
Hi Florian,
Thanks for the clarifiaction. It's clear now. Will these new metric set be the base of the coming separate Kubernetes anomaly detection settings?
Br, Mizső
- Mark as New
- Subscribe to RSS Feed
- Permalink
18 Jul 2022 03:14 PM
Hi @Mizső - absolutely correct. The upcoming improvements for K8s anomaly detection are based on these new metrics.
best
florian
- Mark as New
- Subscribe to RSS Feed
- Permalink
18 Jul 2022 04:45 PM
Hi Florian,
When can we expect this new K8s anomaly detection feature in GA? Which managed version? If it is a public info...
Br, Mizső
- Mark as New
- Subscribe to RSS Feed
- Permalink
19 Jul 2022 02:12 PM
Hi Mizső - it's planned for later this year and has very high prio internally - so I'd hope this plan holds 🙂 There's no fixed GA version yet.
Best,
Florian
- Mark as New
- Subscribe to RSS Feed
- Permalink
13 Jul 2022 05:05 PM
Hi Florian,
Thank you for clearing this up!
P.S: my head already hurts thinking about having to migrate custom events for alerting from the old metrics to the new ones 🙂
Thank you!
Best regards.
- Mark as New
- Subscribe to RSS Feed
- Permalink
18 Jul 2022 03:12 PM
Hi @MariusNicolae - I can understand. sorry for the inconvenience - we really tried hard to come up with some auto-migration, but with the new formats/dimensions, we could not find a reliable way of doing so.
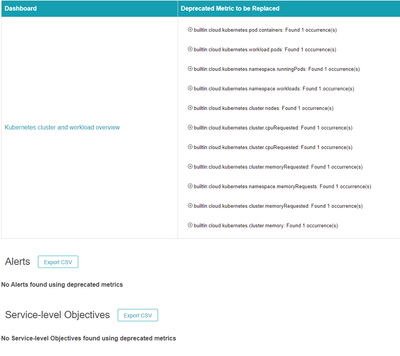
On the positive side: Did you check out the "metric audit tool" mentioned in my other post? This hopefully helps you a lot with this task - if not, feedback is appreciated 🙂
Best
florian
- Mark as New
- Subscribe to RSS Feed
- Permalink
19 Jul 2022 02:10 PM
Hi Florian,
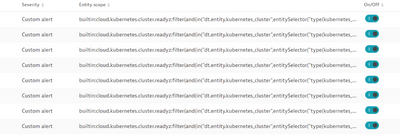
I gave the tool a try and while the dashboard part is right the alerting doesn't seem to be working, at least not in my environment, I have set up a few custom events for alerting using the metrics and on the report they did not show up
I have a few alerts that all use the same metric but with different tags and none of these got picked up by the tool
Is the alerts part not about the custom alerts that are defined?
Thank you!
Best regards.
- Mark as New
- Subscribe to RSS Feed
- Permalink
21 Jul 2022 10:43 AM
Hi @MariusNicolae ,
as you mentioned, this should work for custom alerts as shown in your screenshot. However,
the builtin:cloud.kubernetes.cluster.readyz and builtin:cloud.kubernetes.node.conditions metric are likely updated with AG 1.249 (engineering is currently looking into that), which is why bot of them are not yet mentioned here - consequently, both of them are also not yet part of the tool. Could you please try again with a custom alert based on any of the mentioned metrics from here.
best
florian


