This website uses Cookies. Click Accept to agree to our website's cookie use as described in our Privacy Policy. Click Preferences to customize your cookie settings.
Container platforms
Questions about Kubernetes, OpenShift, Docker, and more.
Turn on suggestions
Auto-suggest helps you quickly narrow down your search results by suggesting possible matches as you type.
- Dynatrace Community
- Ask
- Container platforms
- Re: Kubernetes node level metrics
Options
- Subscribe to RSS Feed
- Mark Topic as New
- Mark Topic as Read
- Pin this Topic for Current User
- Printer Friendly Page
Options
- Mark as New
- Subscribe to RSS Feed
- Permalink
02 Dec 2020 06:23 PM
We have an OpenShift platform with Dynatrace monitoring the cluster. I was trying to fill out the following table at any point of time but was not able to get the stats from Dynatrace. Any help would be appreciated.
| Node | Namespace | Pod | Container | CPU Requests | CPU Limit | Memory Requests | Mem Limit | ||
Solved! Go to Solution.
Labels:
- Labels:
-
kubernetes
-
oneagent
5 REPLIES 5
Options
- Mark as New
- Subscribe to RSS Feed
- Permalink
02 Dec 2020 10:55 PM
Do you have the Cluster being monitored? We can see the follow and much more on our Clusters:
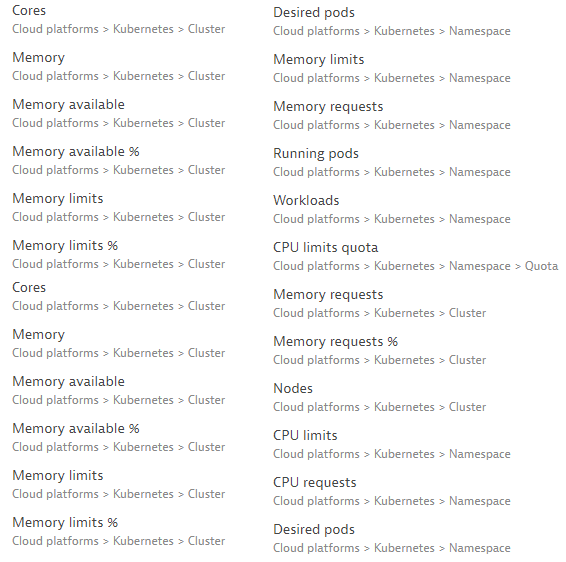
-Chad
Options
- Mark as New
- Subscribe to RSS Feed
- Permalink
02 Dec 2020 11:00 PM
Thanks Chad for the reply!
I do see all these, but the question is how do I get a consolidated view to know the Pods that are running on a particular node and the CPU Request and CPU Limits for each of those pods on that node?
The CPU Limits on Pods doesn't tell on which node these pods are running. I need that data to be tightly coupled.
Options
- Mark as New
- Subscribe to RSS Feed
- Permalink
02 Dec 2020 11:46 PM
totally understandable, but keep in mind, you might not be able to get this all of what you are looking for, in a single chart. We have created one here where were adding in the Desired vs Running Pods overall. With the ability to filter down by Cluster or namespace. We can post this chart to the dashboard, and depending on your current set up, you can leverage management zones that are set to show one singular cluster at a time and configure the life to look at a certain zone- lets say Management zone: EasyTravel_Kubernetes.
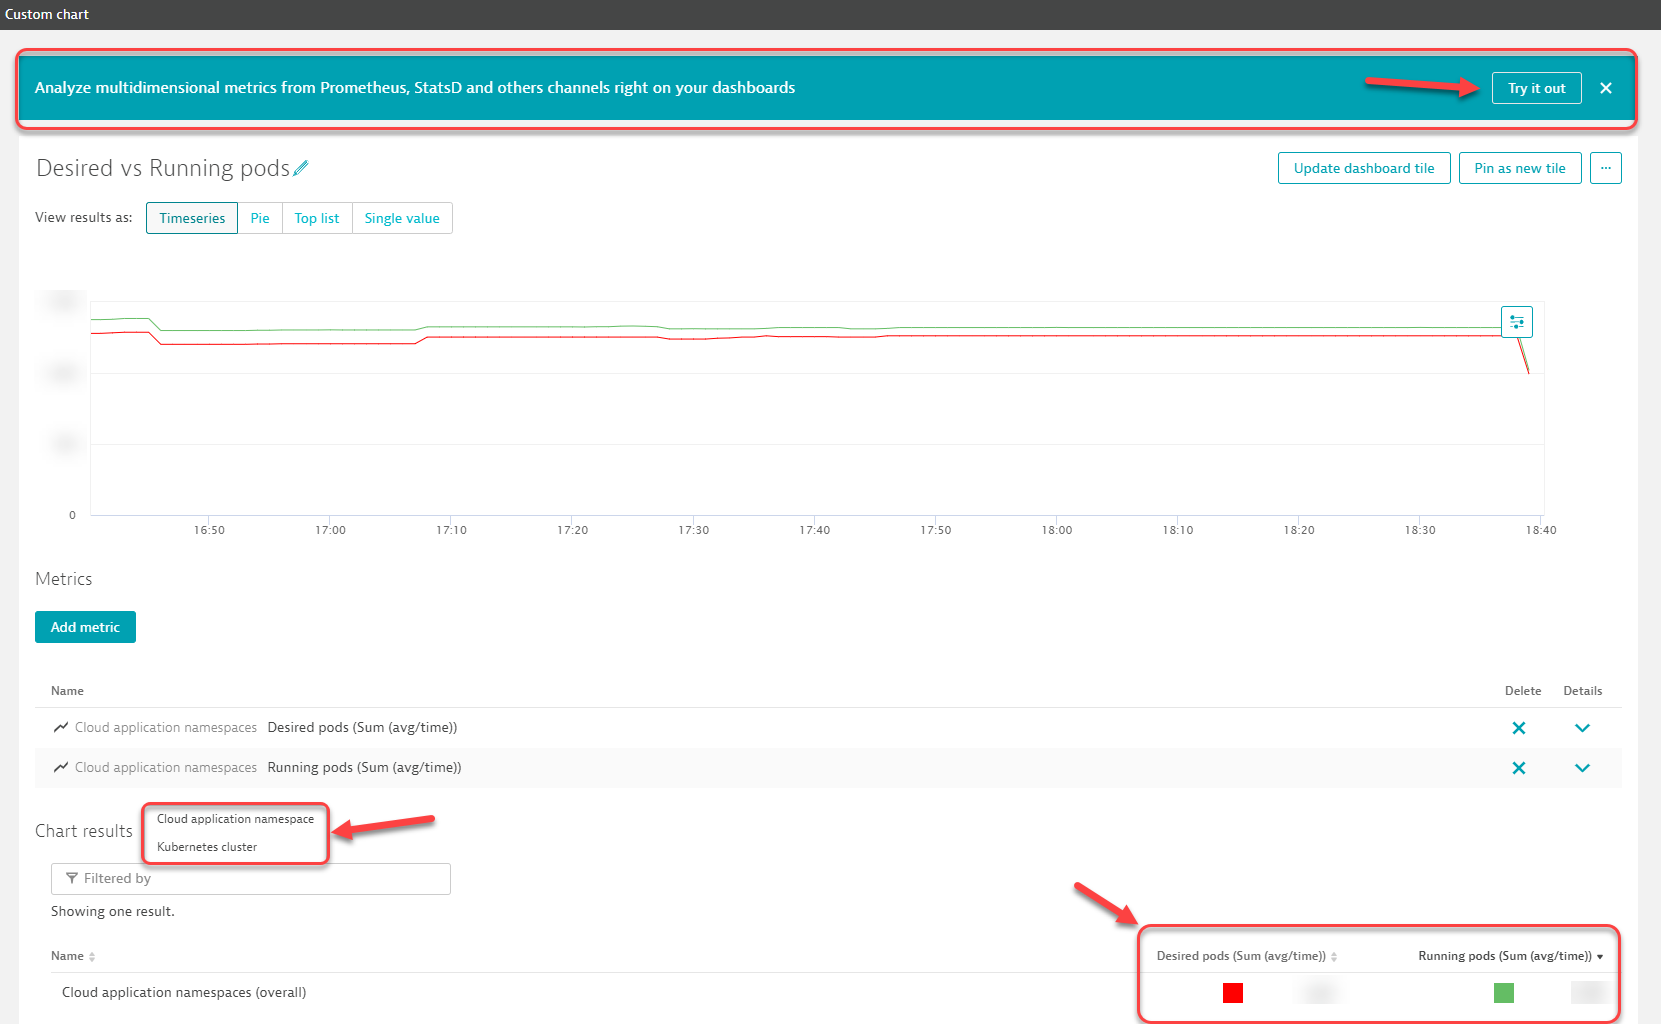
You can also leverage the new explorer view, and can be accessed via that blue/teal ribbon and the try it out button. Also you can use multidimensional analysis views too to add even more metrics in one single chart.
-Chad
Options
- Mark as New
- Subscribe to RSS Feed
- Permalink
03 Dec 2020 06:40 PM
Hello,
We have exactly the same need as Ganesh . We can do it with graph and so on but is quite complex and compared to other monitoring tool like instana/datadog, dynatrace is helping but not so much 😞
Alex
Options
- Mark as New
- Subscribe to RSS Feed
- Permalink
03 Dec 2020 07:41 PM
Thanks Chad once again for trying to help!
Well, I want it in a single view as I would like to find out on why a particular node is maxing out with the CPU requests and can't allocate a new container on that node.
I have looked in to the APIs and tried to pull this information.
- Extract the Host ID (entities API by type=Host) for the nodes that are of interest.
- Extract the Process Group IDs (entities API) for each Host ID.
- Extract the "Kubernetes_Full_Pod_Name" (entities API) for each Process Group ID.
- This gives "Entity (Process Name)", "HostName" - A
- Extract the metrics (CPU limits, CPU Requests, Entity ID) on Pod level using the Metrics API.
- Extract the Management Zone, Entity Name, NameSpace for each entity in the above step using the Entities API.
- This gives "Entity", "MZ", "Namespace" - B
- Merge A and B and gives the consolidated data.
I wish there is an easy way to pull this information rather than making tons of API calls and merging this data.
Featured Posts
