This website uses Cookies. Click Accept to agree to our website's cookie use as described in our Privacy Policy. Click Preferences to customize your cookie settings.
Turn on suggestions
Auto-suggest helps you quickly narrow down your search results by suggesting possible matches as you type.
- Dynatrace Community
- Dynatrace
- Ask
- Dashboarding
- Chart exception count filtered by message
Options
- Subscribe to RSS Feed
- Mark Topic as New
- Mark Topic as Read
- Pin this Topic for Current User
- Printer Friendly Page
Options
- Mark as New
- Subscribe to RSS Feed
- Permalink
21 Jan 2021
08:57 PM
- last edited on
31 Aug 2022
10:43 AM
by
![]() MaciejNeumann
MaciejNeumann
Hi,
Can we chart exception count filtered by exception message?
Any workaround if it is not possible out of the box?
Thank you!
Martin
Digital Performance Optimizer
Solved! Go to Solution.
Labels:
- Labels:
-
dashboards classic
Reply
13 REPLIES 13
Options
- Mark as New
- Subscribe to RSS Feed
- Permalink
21 Jan 2021 09:15 PM
You con't do that out of the box because to do that we would need to be storing long term a metric for every exception which would be way too any timeseries metrics and use up a lot of storage.
What you can do though is create a calculated service metric with the source as request count and filtered down to the specific exception class or message that you are interested in. Then a new metric will be stored for that exception and you can chart it or use it to create alert events as needed.
Reply
Options
- Mark as New
- Subscribe to RSS Feed
- Permalink
18 Mar 2021 09:09 AM
Hello Martin,
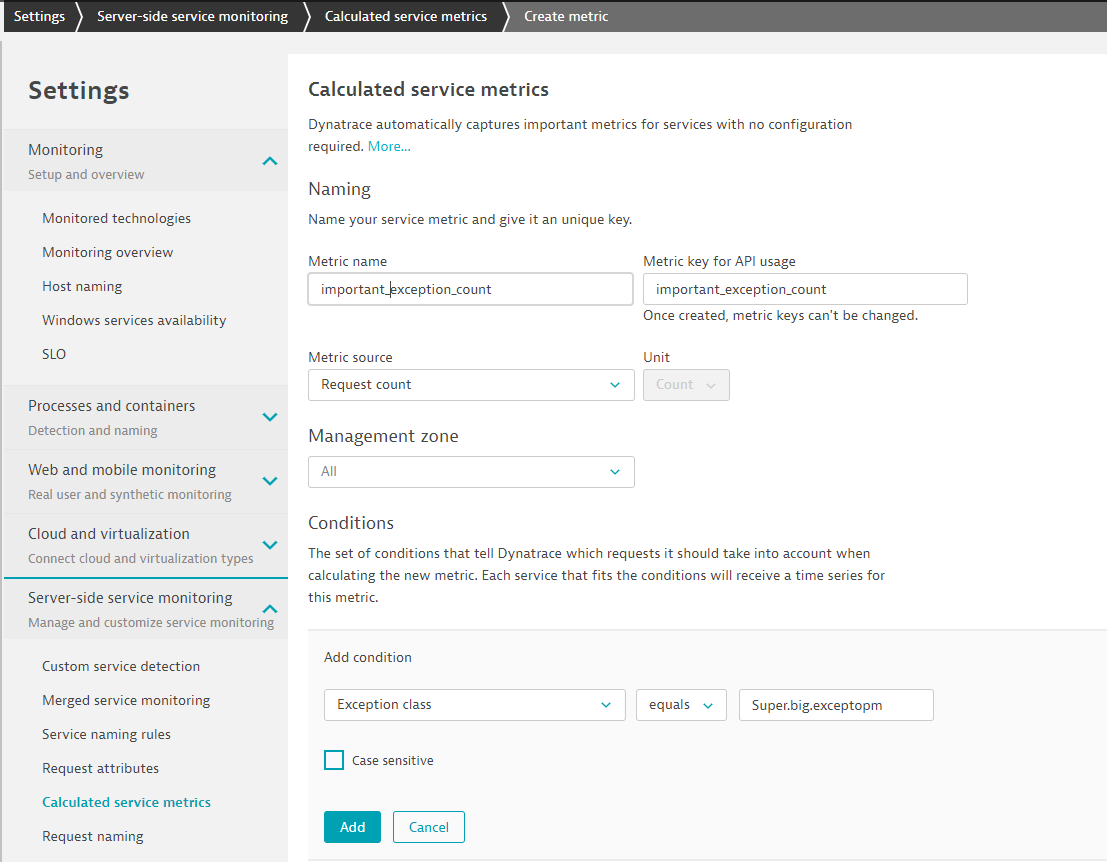
Yes, it's possible. For this you must create a "Calculated service metrics"
In this exmple i would like track the locktable with Dynatrace.
Use "exception class" and select what typologie of exception you would receive (In my exemple it's for SQL request).

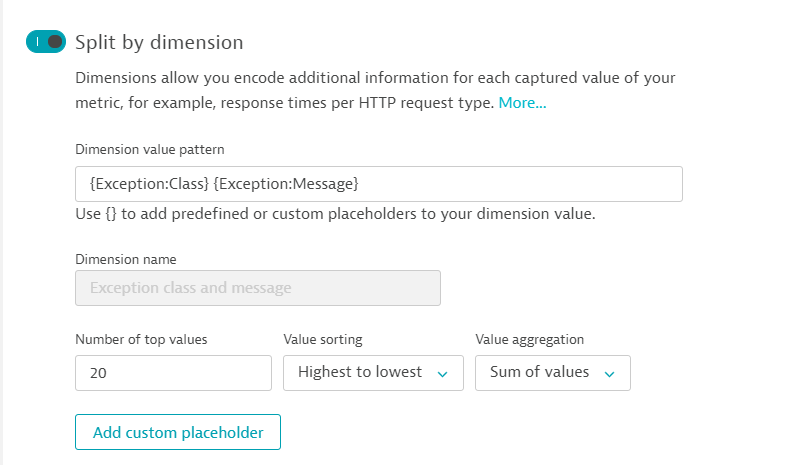
Dont forget to split with Dimension : Exception class and message

last step :
Create a custom Dashboard with your metric inside like standart metric.
If you would like to navigate to your exception, you must create a direct link to "Multidimensionnal analysis" like this :

Hope can help you
Regards
Julien D.
Reply
Options
- Mark as New
- Subscribe to RSS Feed
- Permalink
12 Apr 2021 09:30 PM
Hi all,
Once the metric is collected, is there any way to drill down or find the purepath that have the exact exception message and thus related to an exception message metric ?
There is a filter for exception class but the exception message filter does not seem to exist.

Options
- Mark as New
- Subscribe to RSS Feed
- Permalink
13 Apr 2021 11:30 AM
Hey Alain,
The exception class is bug. You cannot retrieve your exact message with it.
Thats why i play with differents scenario :
1rst : Select the service and filter with exception details, (working well but cannot transform into a dashboard unftornatly).
2nd way : Set requests attributes and filter with for display all transactions you are looking for. You can retrieve this information with Purepath or Diagnostic tool, does not matter.
Reply
Options
- Mark as New
- Subscribe to RSS Feed
- Permalink
13 Apr 2021 02:32 PM
Thanks Julien,
There is no "exception message" filter available in the service MDA analysis view, only "exception class". Since the "exception class" in our case is general and applies to many transactions and the "exception message" is the only thing specific to the purepath we're looking for, seems we're out of luck.
Options
- Mark as New
- Subscribe to RSS Feed
- Permalink
14 Apr 2021 11:36 PM

Usually, i'm looking generical message, who can be relevant like that. I'm dril down on my critical service.. and show messsage "exception message". It's little bit boring, but it's much easier to drill down in ton of log files :=)
Options
- Mark as New
- Subscribe to RSS Feed
- Permalink
28 Jun 2021 12:11 AM
Hi @julien_duhamel1 , @Malaik , @AlanZ ,
If you feel Dynatrace should have the exception message better displayed/filtered in multi-dimensional analysis views, please kindly vote on my existing product idea for it:
https://community.dynatrace.com/t5/Dynatrace-product-ideas/RFE-Add-exception-message-to-MDA-Exceptio...
Regards,
Andrew M.
Andrew M.
Options
- Mark as New
- Subscribe to RSS Feed
- Permalink
21 Jun 2021 09:47 AM
Thanks for your time and your post, very interesting (Merci beaucoup).
I have 2 questions if possible:
Same thing for me I want to split each Generic Exception By message, or filter by message... (one generic exception have a lot of exceptions: the difference is the MESSAGE).
Second thing, the result is not correct for me
I use this calculated metric


and that is the result:

in the diagnostic tool:

Question: why the system count 4*2 (8Exceptions) knowing that I have only one Purepath that have 2 exceptions with the same message
Thanks for your help.
Sharing Knowledge
Options
- Mark as New
- Subscribe to RSS Feed
- Permalink
22 Jun 2021 08:05 AM - edited 22 Jun 2021 08:15 AM
Good question, to my understanding : You are using executing 4X the same lib time your webrequest.
To confirm, is you made a purepath/purepath., you should have same information. (Exception)
This exactly why, i group "message". Try to add "Exeception class" in dimension field. Should be help.
It's complex to create "familly of message" in level of Webservice, this is why i prefer looking side SQL execution, you find some very valuable informations.
To my perception, read message in real time, it's incredible powerfull for RUN teams., you can catch "Token issues", "cerficate expired", "every applicative errors" .
Hop can be help
Julien
Options
- Mark as New
- Subscribe to RSS Feed
- Permalink
22 Jun 2021 08:41 AM
Hello @julien_duhamel1
Totally agree, but this is the requirement of our customer 😞 .
Sharing Knowledge
Options
- Mark as New
- Subscribe to RSS Feed
- Permalink
22 Jun 2021 09:16 AM
Hi @julien_duhamel1 , another thing
I want to make the same thing with the response time, impossible for me to split by message.
I want to make a dashboard to link Requests Count and Response Time for each Exception Message.
Thanks
Sharing Knowledge
Options
- Mark as New
- Subscribe to RSS Feed
- Permalink
27 Jun 2021 10:53 PM
Add me on linkedin, your case look not impossible. 🙂
Options
- Mark as New
- Subscribe to RSS Feed
- Permalink
28 Jun 2021 10:36 AM
Thanks Julien
https://www.linkedin.com/in/abdelmalek-latarsa-68443745/
This is mine
Sharing Knowledge
