- Dynatrace Community
- Ask
- Dashboarding
- Dashboards | Clustered bar chart
- Subscribe to RSS Feed
- Mark Topic as New
- Mark Topic as Read
- Pin this Topic for Current User
- Printer Friendly Page
- Mark as New
- Subscribe to RSS Feed
- Permalink
18 Dec 2023
10:53 AM
- last edited on
22 Dec 2023
09:40 AM
by
![]() Ana_Kuzmenchuk
Ana_Kuzmenchuk
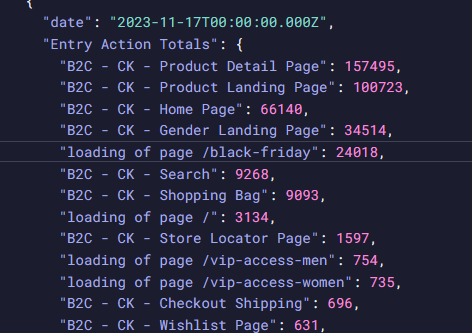
I have an api query which returns the results of per day, the total number of entry actions per page, over a period of time.
import { rumUserSessionsClient } from '@dynatrace-sdk/client-classic-environment-v1';

const query = 'SELECT useraction.name AS "Entry Actions", COUNT(usersession.userSessionId) AS "Number of Sessions", AVG(useraction.duration) AS "Average session duration" FROM useraction WHERE useraction.application=\'PRD - B2C - Calvin Klein\' AND useraction.type="Load" AND useraction.isEntryAction IS TRUE GROUP BY useraction.name, useraction.type LIMIT 15';

export default async function () {
  // Define the start and end dates for your desired range
  const startDate = new Date('2023-11-17T00:00:00Z'); // Replace with your start date
  const endDate = new Date('2023-11-28T00:00:00Z'); // Replace with your end date

  // Adjust timestamps to UTC
  const startTimestampUTC = startDate.getTime();
  const endTimestampUTC = endDate.getTime();

  // Adjust timestamps to UTC+1
  const startTimestamp = startTimestampUTC - 60 * 60 * 1000;
  const endTimestamp = endTimestampUTC - 60 * 60 * 1000;

  // Iterate over each day in the range
  const records = [];
  let currentDate = new Date(startDate);

  while (currentDate <= endDate) {
    // Calculate timestamps for the current day
    const startOfDay = new Date(currentDate);
    startOfDay.setUTCHours(0, 0, 0, 0);
    const startTimestamp = startOfDay.getTime();

    const endOfDay = new Date(currentDate);
    endOfDay.setUTCHours(23, 59, 59, 999);
    const endTimestamp = endOfDay.getTime();

    // Make Dynatrace SDK request for the current day
    const response = await rumUserSessionsClient.getUsqlResultAsTable({
      query: query,
      startTimestamp: startTimestamp,
      endTimestamp: endTimestamp
    });

    // Process the response and add to records
    const columnNames = response.columnNames;
    const values = response.values;

    const entryActionTotals = {};

    values.forEach(row => {
      const entryAction = row[columnNames.indexOf("Entry Actions")];
      const sessions = parseInt(row[columnNames.indexOf("Number of Sessions")], 10);

      // Accumulate totals for each entry action
      if (!entryActionTotals[entryAction]) {
        entryActionTotals[entryAction] = 0;
      }
      entryActionTotals[entryAction] += sessions;
    });

    records.push({
      date: currentDate.toISOString(),
      "Entry Action Totals": entryActionTotals
    });

    // Move to the next day
    currentDate.setDate(currentDate.getDate() + 1);
  }

  return records;
}
This gets me the results i am after if i visualize this in a raw format.
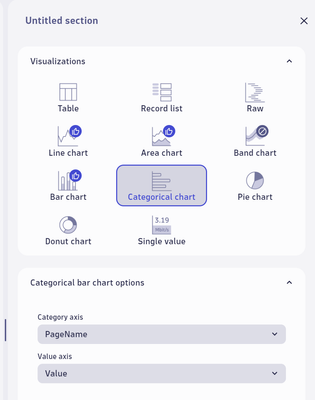
However i would like to be able to generate a bar chart where you see the totals for each entryaction per day over the period of time i set in the query. So basically a clustered bar chart. Is this possible to archieve?
Solved! Go to Solution.
- Labels:
-
charts
-
dashboards
-
latest dynatrace
-
notebooks
- Mark as New
- Subscribe to RSS Feed
- Permalink
18 Dec 2023 10:44 PM
hi @bpdvries
It looks like your output contains complex records, which show in record output unlike the raw output.
You are also not outputting the timestamp as a string. See amended script below:
import { rumUserSessionsClient } from '@dynatrace-sdk/client-classic-environment-v1';
export default async function () {

const query = 'SELECT useraction.name AS "Entry Actions", COUNT(usersession.userSessionId) AS "Number of Sessions", AVG(useraction.duration) AS "Average session duration" FROM useraction WHERE useraction.application=\'PRD - B2C - Calvin Klein\' AND useraction.type="Load" AND useraction.isEntryAction IS TRUE GROUP BY useraction.name, useraction.type LIMIT 15';


  const startDate = new Date('2023-11-17T00:00:00Z');
  const endDate = new Date('2023-11-28T00:00:00Z');

  const chartData = [];

  let currentDate = new Date(startDate);

  while (currentDate <= endDate) {
    const startOfDay = new Date(currentDate);
    startOfDay.setUTCHours(0, 0, 0, 0);
    const startTimestamp = startOfDay.getTime();

    const endOfDay = new Date(currentDate);
    endOfDay.setUTCHours(23, 59, 59, 999);
    const endTimestamp = endOfDay.getTime();

    const response = await rumUserSessionsClient.getUsqlResultAsTable({
      query: query,
      startTimestamp: startTimestamp,
      endTimestamp: endTimestamp
    });

    const columnNames = response.columnNames;
    const values = response.values;

    values.forEach(row => {
      const entryAction = row[columnNames.indexOf("Entry Actions")];
      const sessions = parseInt(row[columnNames.indexOf("Number of Sessions")], 10);

 chartData.push({
  Date: startOfDay.toISOString(), // Use startOfDay for the timeframe in the specified format
  PageName: entryAction,
  Value: sessions
});
    });

    currentDate.setDate(currentDate.getDate() + 1);
  }

  return chartData;
}
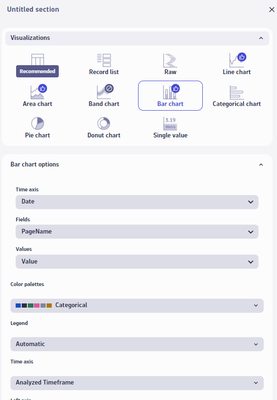
Visualization parameters:
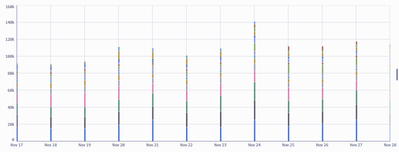
Output will look like this:
Hope this helps,
Lawrence
- Mark as New
- Subscribe to RSS Feed
- Permalink
22 Dec 2023 09:33 AM - edited 22 Dec 2023 09:41 AM
Hi Lawrence,
Thanks a lot! Do you also know if it is possible show the bar charts next to each other instead of one bar where all the data points are on top of each other?
- Mark as New
- Subscribe to RSS Feed
- Permalink
22 Dec 2023 10:00 AM
Hi,
Yes. Thanks.
Featured Posts


