This website uses Cookies. Click Accept to agree to our website's cookie use as described in our Privacy Policy. Click Preferences to customize your cookie settings.
Turn on suggestions
Auto-suggest helps you quickly narrow down your search results by suggesting possible matches as you type.
- Dynatrace Community
- Dynatrace
- Ask
- Dashboarding
- Re: How to export the data into CSV
Options
- Subscribe to RSS Feed
- Mark Topic as New
- Mark Topic as Read
- Pin this Topic for Current User
- Printer Friendly Page
Options
- Mark as New
- Subscribe to RSS Feed
- Permalink
25 Jun 2020
04:37 PM
- last edited on
17 Mar 2023
10:56 AM
by
![]() Ana_Kuzmenchuk
Ana_Kuzmenchuk
Hi, Is there a way to export the raw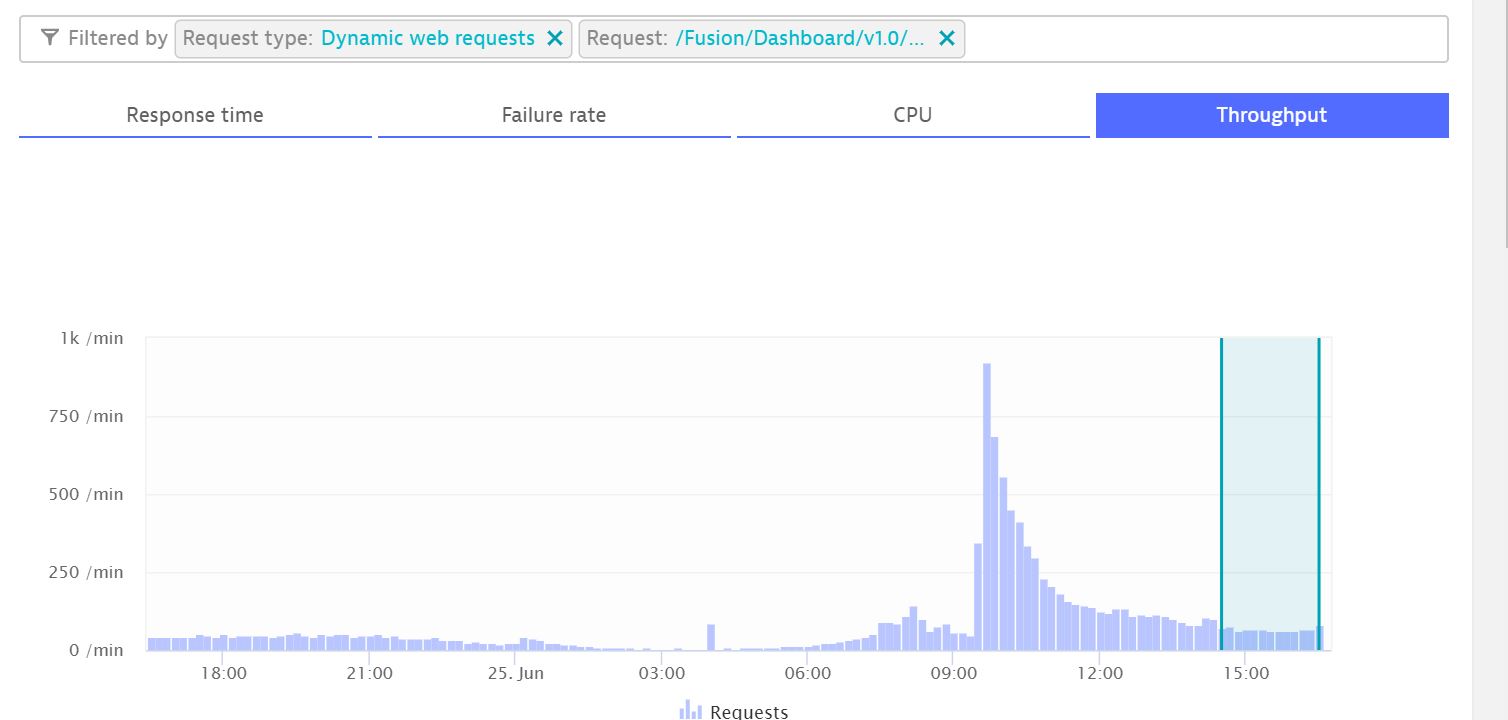 data into a CSV? I have a API/service and i need to export the data on per minute basis for that API. Is there a way to achieve that in Dynatrace?
What i am doing is this -
I am going to "Transaction and Services" -> Enter my request as above in the screenshot i copied and i get that chart. From the chart you can see there is a spike around 10 AM. So what i want is export the raw data and see the per minute request from 09:00 AM to 12:00 PM.
Solved! Go to Solution.
Labels:
- Labels:
-
metrics
13 REPLIES 13
Options
- Mark as New
- Subscribe to RSS Feed
- Permalink
25 Jun 2020 04:50 PM
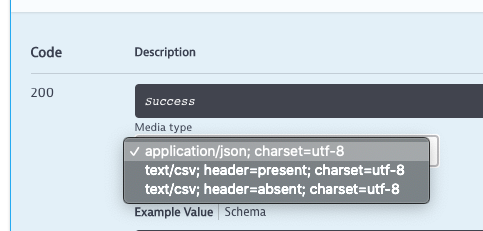
In case you are using the /api/v2/metrics api, you can simply switch the output type to CSV by specifying the Content-Type: CSV in the HTTP Request header.
See the in product API Explorer for details.
See below:
Reply
Options
- Mark as New
- Subscribe to RSS Feed
- Permalink
25 Jun 2020 04:56 PM
Not really. I am going to "Transaction and Services" -> Enter my request as above in the screenshot i copied and i get that chart. From the chart you can see there is a spike around 10 AM. So what i want is export the raw data and see the per minute request from 09:00 AM to 12:00 PM.
Reply
Options
- Mark as New
- Subscribe to RSS Feed
- Permalink
29 Jul 2024 03:09 AM
Can I use the same approach to get the USQL date in tabular form using running query.

Options
- Mark as New
- Subscribe to RSS Feed
- Permalink
25 Jun 2020 05:08 PM
Hi Shashank,
There is no way to directly export to CSV from the screen you are viewing.
However there are two options you could take:
- Recreate the graph in a "custom chart" where you have the ability to export to csv.
- Use the metrics API like Wolfgang suggested and pull the throughput metric for the key request.
Let me know if you need help with either of those methods.
Thanks
-Dallas
Reply
Options
- Mark as New
- Subscribe to RSS Feed
- Permalink
25 Jun 2020 05:29 PM
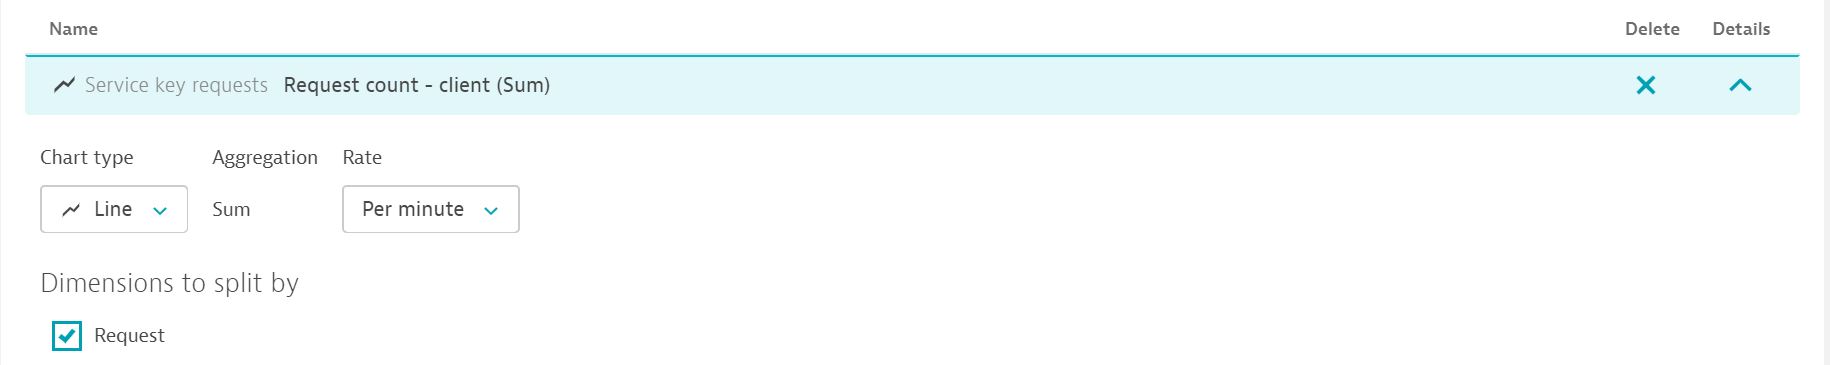
@Dallas P. Thank you for the response. So I have tried the 1st method where I am creating a customer chart and then Add metric -> Request count - client (Sum) as attached. I select the time range as 03:00 AM to 11: AM and export the result in CSV.
When i see the exported CSV, I see the time difference is 5 minutes and the count. So that count average number because it contains decimal? It seems the the longer the time range i select, the time range gets increased in the exported CSV. Please if you can confirm if this is expected?
| |||||||||
Also, Request count - client (Sum) - Is this the correct metric I have selected?
Also I have no idea how to do that using metrics API. If you can advice, that would be hugely appreciated.
Reply
Options
- Mark as New
- Subscribe to RSS Feed
- Permalink
25 Jun 2020 06:01 PM
Hi Shashank,
Yes, the time interval change you see is expected. The larger the timeframe you are viewing the more time will be in each data point interval. The only way to get around this and to accurately plot every single minute would be to use the metrics api.
I would use "Request count" metric without " - client" at the end:
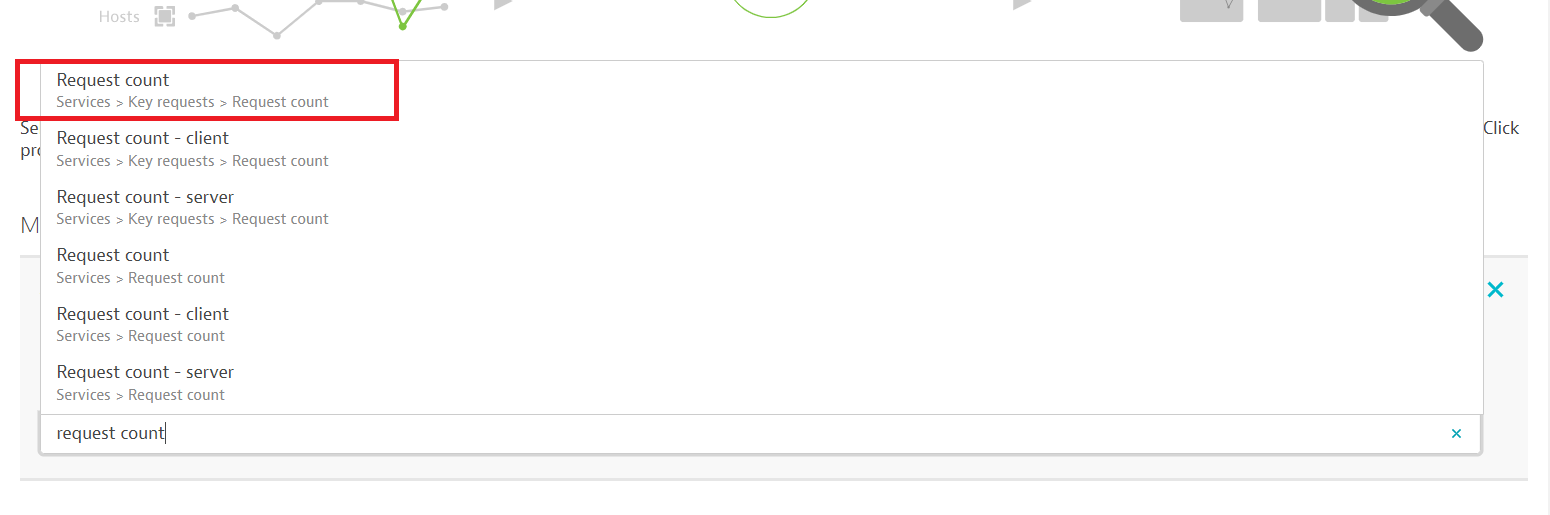
As for querying the API for the metric you are looking for the best way to do that would be to:
- Query the "GET all metrics" endpoint to find the metric you are looking at. In this case it is "builtin:service.keyRequest.count.total"
- Query the "GET metric descriptor" endpoint
- Query the "GET metric datapoint" endpoint
You can use an API testing program to test these endpoint out (I use Talend API Tester Chrome extension)
Here is the link to the Dynatrace documents with the info on how to do all of this. If you run into issues querying these API's post them below and I will help troubleshoot when possible.
https://www.dynatrace.com/support/help/dynatrace-api/environment-api/metric-v2/
-Dallas
Reply
Options
- Mark as New
- Subscribe to RSS Feed
- Permalink
26 Jun 2020 03:02 PM
@Dallas P. Thanks for the detailed response. I looked into the metrics API and tried to hit the URL with some params but I received this error "
{"error":{"code":401,"message":"Missing authorization parameter."}}"
I believe there are some extra steps required to generate some kind of authentication. Not sure if i can do that with the rights I have so I am seeking my DT admin help for the same.
If you can add your inputs that will be really helpful. Many thanks again.
Reply
Options
- Mark as New
- Subscribe to RSS Feed
- Permalink
26 Jun 2020 04:55 PM
Hey Shashank,
You need to get a token from your administrator to authenticate with the API.
They should be able to find it in Settings -> Integration -> Dynatrace API
Once you have a token with the correct permissions you can append the token onto the end of your query and you should no longer see that message. 🙂
-Dallas
Reply
Options
- Mark as New
- Subscribe to RSS Feed
- Permalink
26 Jun 2020 05:19 PM
@Dallas P. Brilliant. You are a star and this forum is really helpful. I will check this and get back if i face any further issues. Thanks again very much 🙂
Reply
Options
- Mark as New
- Subscribe to RSS Feed
- Permalink
24 May 2022 07:36 PM
Starting with 1.239 you can also use the Data explorer to export your metrics data to CSV.
Reply
Options
- Mark as New
- Subscribe to RSS Feed
- Permalink
02 Jun 2022 02:53 PM
And with 1.244 say hello to table csv exports.
Based on your feedback we kept it simple and what you see is what you get!
Enjoy!

Reply
Options
- Mark as New
- Subscribe to RSS Feed
- Permalink
13 Jun 2022 08:59 AM
Related product idea for the rest of Dynatrace: https://community.dynatrace.com/t5/Dynatrace-product-ideas/Export-to-CSV-option-throughout-the-UI/id...
Options
- Mark as New
- Subscribe to RSS Feed
- Permalink
12 Jan 2023 10:30 PM
uSQL export to csv is a must.
Really surprised that such functionality is not available.
At the very least, make it available from the uSQL window, after the results are displayed in a table mode.
Reply
