Turn on suggestions
Auto-suggest helps you quickly narrow down your search results by suggesting possible matches as you type.
- Dynatrace Community
- Dynatrace
- Ask
- Dashboarding
- Re: Filtering by Request in Data Explorer
Options
- Subscribe to RSS Feed
- Mark Topic as New
- Mark Topic as Read
- Pin this Topic for Current User
- Printer Friendly Page
Options
- Mark as New
- Subscribe to RSS Feed
- Permalink
11 Apr 2022
08:19 PM
- last edited on
25 May 2023
10:31 AM
by
![]() Michal_Gebacki
Michal_Gebacki
Hi,
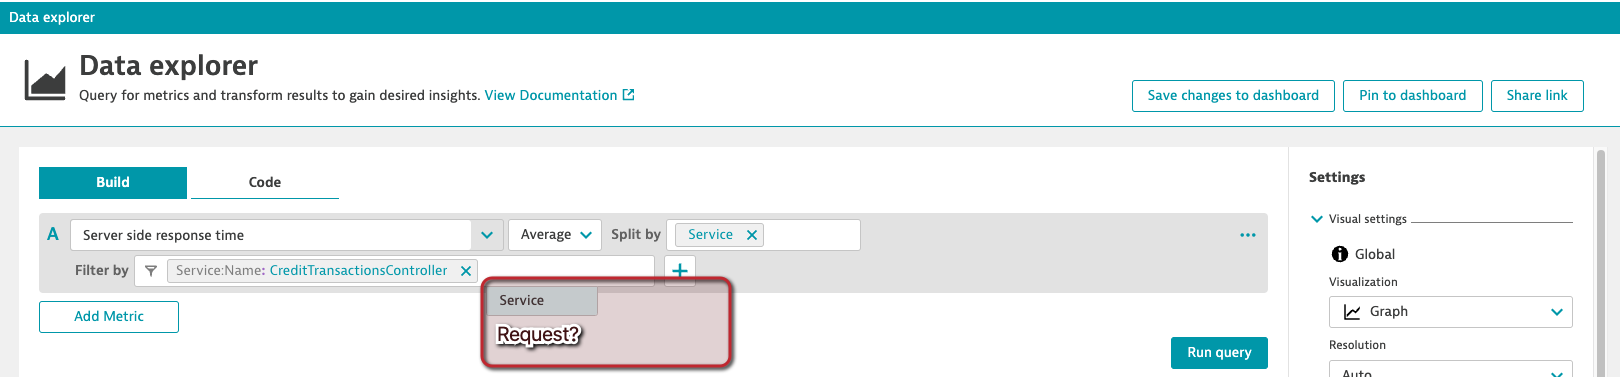
I'm fairly new to Dynatrace but I am struggling with some of the differences between Data Explorer and Multidimensional Analysis. One of the things I like about multidimensional analysis views is that I can filter service data by a particular request. I've noticed that in Data Explorer (i.e. when configuring a new graph tile) I can't seem to drill down to the request level for any given service.
In most cases I am not interested in seeing the aggregate response time for all requests for a given service, as some responses (i.e ones that I care less about) would skew the data.
So my questions are:
1. Why do the data explorer and multidimensional analysis pages offer different filtering options?
2. Given these differences, how can I create a Dashboard tile that shows only the response time of a single request for a given service (when the service in question has multiple requests associated with it)?
See screenshots for an example.
Solved! Go to Solution.
Labels:
data_explorer.png
69 KB
mda.png
61 KB
3 REPLIES 3
Options
- Mark as New
- Subscribe to RSS Feed
- Permalink
11 Apr 2022 09:50 PM - edited 11 Apr 2022 09:53 PM
Hi swin12,
You should be able to create a dashboard with a tile that shows a single or multiple requests' response time. All you need is to mark these requests as "Key Request", then select the proper metric and split by request. You can even filter the view to show specific requests. Here is an example.


I hope this helps.
Reply
Options
- Mark as New
- Subscribe to RSS Feed
- Permalink
11 Apr 2022 10:03 PM
Hi Moe,
Thanks. I have marked some requests as "Key requests," however I do not seem to get "Request" as an autocomplete option for the "Split By" filter. I saw that when marking the key request, that it may "take a while":
Marked as key request. Please be aware that it takes a while until data explorer and dashboard tiles will show data for this request.
Do you have any insight as to:
1. How long this delay might be?
2. A place I can check (after "a while" has elapsed) to confirm that the request is functioning as a key request? (Maybe data explorer is as good as any...)
In any event, it sounds like I may just need to wait for the key requests to be "properly" marked.
Options
- Mark as New
- Subscribe to RSS Feed
- Permalink
11 Apr 2022 10:29 PM
Ah, I had missed that you were selecting:
"builtin:service.keyRequest.response.server"
instead of:
"builtin:service.response.server"
Having selected the first metric, I was able to create a dashboard tile for a single key request. Thanks again @Mo_Azuz!
Reply
