- Dynatrace Community
- Dynatrace
- Ask
- Dashboarding
- Re: Request Attribute: handler Name - Dashboard Service Overview
- Subscribe to RSS Feed
- Mark Topic as New
- Mark Topic as Read
- Pin this Topic for Current User
- Printer Friendly Page
- Mark as New
- Subscribe to RSS Feed
- Permalink
08 Feb 2024 11:21 AM
HI.
I want to do the following: Request Attribute: handler Name
But is it possible to do it without creating a metric:CALC these are something that are built-in
Solved! Go to Solution.
- Labels:
-
dashboards
-
data explorer
- Mark as New
- Subscribe to RSS Feed
- Permalink
08 Feb 2024 12:26 PM
Hi @yuval1983
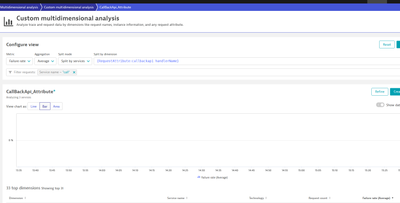
You can make a view to track the Request Attribute on the Miltidimentional View. Unfortunately if you want to transfer to the dashboard then you need to create a metric.
Radek
- Mark as New
- Subscribe to RSS Feed
- Permalink
08 Feb 2024 01:51 PM
HI,
Is it possible to combine the failure rate and response time in the MDA?
- Mark as New
- Subscribe to RSS Feed
- Permalink
08 Feb 2024 02:10 PM
No. You can, however, set a filter to show only erroneous requests or requests with a specific response time.
- Mark as New
- Subscribe to RSS Feed
- Permalink
08 Feb 2024 02:36 PM
Can you attach an example?
- Mark as New
- Subscribe to RSS Feed
- Permalink
08 Feb 2024 04:57 PM - edited 08 Feb 2024 05:05 PM
HI,
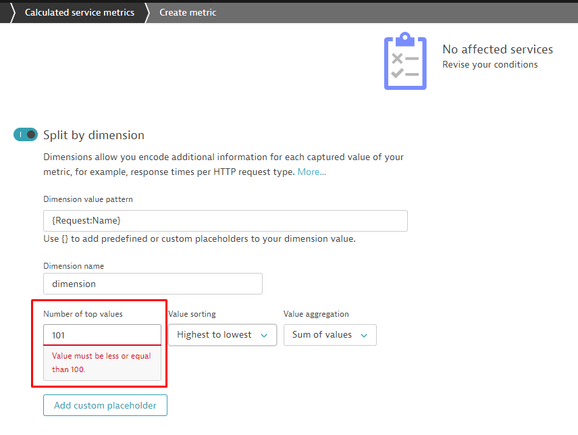
Is it possible to do more than 10 dimensions?
I'm a little disappointed that I only have 10 listed
Another question, is it possible to do all this in the new dashboard?
- Mark as New
- Subscribe to RSS Feed
- Permalink
08 Feb 2024 07:35 PM
Hi @yuval1983
When you create the calculated service metric, you can choose the limit of the dimensions (100).
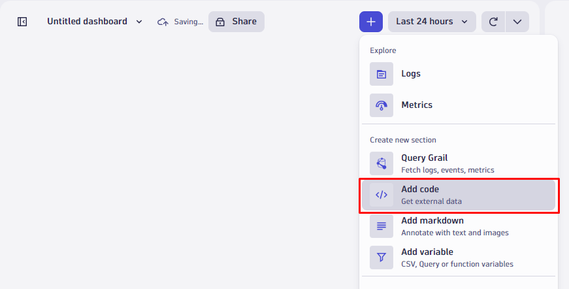
Also, on 3rd Gen Dashboards you can use a JavaScript Code to get the calculated service metric datapoints using the SDK.
Classic Environment V2 | Dynatrace Developer
import { metricsClient } from "@dynatrace-sdk/client-classic-environment-v2";

const data = await metricsClient.query({
  acceptType: "application/json; charset=utf-8",
});
Regards,
- Mark as New
- Subscribe to RSS Feed
- Permalink
09 Feb 2024 10:52 AM
Thanks @cesarsaravia for the clarification for @yuval1983 . Yesterday, I already didn't manage to write back.
Radek


