- Dynatrace Community
- Dynatrace
- Extend
- Dynatrace API
- Time-series Monitoring and visualization
- Subscribe to RSS Feed
- Mark Topic as New
- Mark Topic as Read
- Pin this Topic for Current User
- Printer Friendly Page
Time-series Monitoring and visualization
- Mark as New
- Subscribe to RSS Feed
- Permalink
11 Jan 2024 05:07 PM
How can we effectively send custom time-series data to Dynatrace for detailed monitoring and visualization? What are the necessary steps to create and configure a custom device using Dynatrace's APIs, particularly for handling time-series metrics like CPU and memory usage? How do tools like curl or Postman fit into the process of posting these time-series data sets, and once the data is sent, how can we ensure it is accurately visualized and interpreted in Dynatrace dashboards? Furthermore, what are the best practices to follow for securely and efficiently managing the transmission and visualization of time-series data within Dynatrace?
- Labels:
-
dynatrace api
-
metrics
- Mark as New
- Subscribe to RSS Feed
- Permalink
21 Jan 2024 08:02 AM
To send the information to dynatrace utilize Metrics API - POST ingest data points
For topology use Custom topology model
HTH
Yos
- Mark as New
- Subscribe to RSS Feed
- Permalink
21 Jan 2024 08:14 PM
If you are injecting from a host with OneAgent, you can also use the metric script integration:
https://docs.dynatrace.com/docs/extend-dynatrace/extend-metrics/ingestion-methods/oneagent-pipe
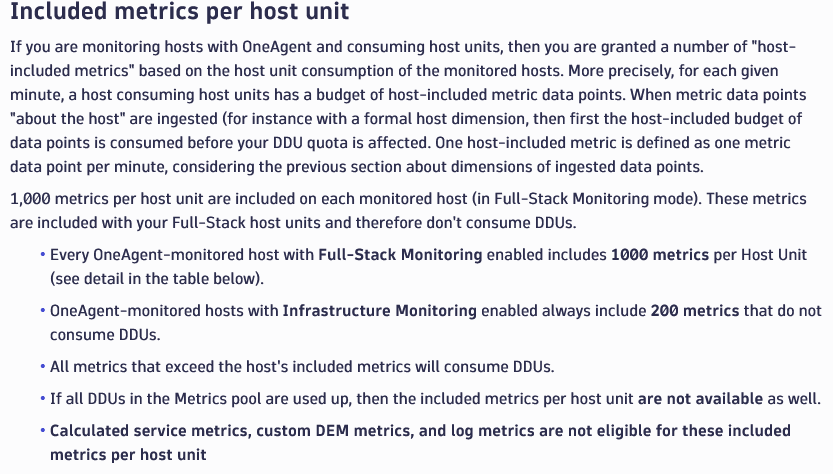
Please note that these metrics injections do not consume DDUs to a certain level:
If you don't have OneAgent, there are several other options for injecting data, like with Prometheus & Telegraf. Take a look at:
https://docs.dynatrace.com/docs/extend-dynatrace/extend-metrics

