- Dynatrace Community
- Learn
- Dynatrace tips
- Tutorial - How to consume Dynatrace SaaS Audit logs into Splunk Enterprise
- Subscribe to RSS Feed
- Mark Topic as New
- Mark Topic as Read
- Pin this Topic for Current User
- Printer Friendly Page
Tutorial - How to consume Dynatrace SaaS Audit logs into Splunk Enterprise
- Mark as New
- Subscribe to RSS Feed
- Permalink
27 Feb 2020
02:03 PM
- last edited on
04 Sep 2023
10:19 AM
by
![]() MaciejNeumann
MaciejNeumann
How to consuming Dynatrace SaaS Audit logs into Splunk Enterprise
I apologize for being so late on this tutorial. I know I promised it over a month ago. As you may or may not know, recently Dynatrace made Audit logs available. This has been a long time coming and I for one am extremely happy to now have access to these.
If you are a Dynatrace SaaS and Splunk Enterprise customer you must be thinking right now…
“Nice! I am going to bring those Dynatrace audit logs into Splunk.”
But, there are 2 roadblocks in your way that will prevent this which are...
- Dyantrace does not schedule or push these logs.
- Splunk Enterprise does not provide the ability to make REST calls.
This is where this tutorial comes in and overcomes these 2 roadblocks, so let’s get started.
This tutorial makes a few assumptions.
Dynatrace assumptions
- You are using Dynatrace SaaS.
- You have an administrative account for your Dynatrace tenant(s) that allows you to generate API tokens.
- You know how to utilize the Dynatrace API and more specifically, the Dynatrace Environment API.
Splunk assumptions
- You are using Splunk Enterprise on-prem.
- Our Splunk enterprise instance is on-prem so this tutorial is based on Splunk enterprise on-prem.
- You have an administrative account for your instance of Splunk Enterprise that allows you to install Splunk plugins.
- You have an account for https://splunkbase.splunk.com.
- You are familiar with installing Splunk plugins.
Step #1
Download the BaboonBones REST API Modular Input v1.6 Splunk plugin
This is a great little company who develops plugins for Splunk and one of those plugins is called the “REST API Modular Input v1.6”. This is a Splunk modular input add-on for polling REST APIs from such things as Dynatrace SaaS.
You can install this plugin one of 2 ways in Splunk.
Method #1 - From within the Splunk UI
Open your instance of Splunk Enterprise and login with a Splunk admin account which has permissions to install Splunk plugins. In my case I am using Splunk Enterprise on-prem. Once logged in with administrative privileges, select “Apps” from the dropdown menu next to the Splunk Enterprise logo.
Once on the Apps screen in Splunk Enterprise, type REST into the search box and hit enter. Once the results are shown, ensure you select the “REST API Modular Input” plugin as seen below.
Within my screenshot, you can see Splunk Enterprise knows I have already installed the Splunk plugin as indicated by the button to the right which says “Already Installed”. In your case, that same button should provide you the ability to install the plugin.
It should be noted that Splunk Enterpriise will require a Splunkbase login to conduct the install and will prompt you when needed.

Method #2 - From Splunkbase outside the Splunk Enterprise UI
Download the plugin from Splunkbase here.
You will need a Splunkbase account to start the download. Once you have downloaded the plugin from the Splunkbase website, log into your Splunk Enterprise instance with administrative privileges and install the plugin as you would any other Splunk Enterprise plugin.
You can find help on how to install a Splunk Enterprise plugin here if needed.
Step #2
Obtain a free 7 day trial key for plugin or purchase a non expiring key for $99
BaboonBones offers a free 7 day trial key so you can take it for a test drive. I would recommend using the trial first to ensure everything works as you are expecting. If you decide to purchase the plugin, BaboonBones also offers support plans if you decided support is needed.
Click here to obtain the free 7 day trial key.
Step #3
Create a Dynatrace SaaS API token
Dynatrace requires REST calls to supply an API token for authorization. Login to the Dynatrace SaaS tenant you wish to collect the audit logs from with an administrative account that can generate Dynatrace SaaS tokens. Once logged in, select “Settings”, “Integration”, and then “Dynatrace API” as seen below.

Once on the Dynatrace API screen in the UI, select the button for “Generate token”. Note that you can name this token however you like.

For the permissions, only enable the “Read audit logs” toggle switch and then press the “Generate” button at the bottom of the screen.
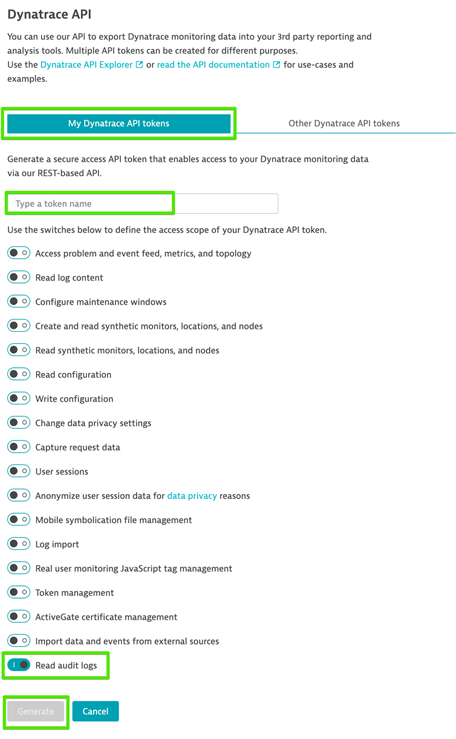
Dynatrace will then show the newly generated token. Press the “Copy” button to take a copy of this token into your clipboard. Note that you can always return to this API screen at any time to retrieve the generated token as needed.

Step #4
Configure the Splunk Enterprise Data inputs
You should still be logged into Splunk Enterprise within an administrative account at this time. Within Splunk Enterprise, select “Settings”, “Add Data”, and then “Data inputs” as seen below.
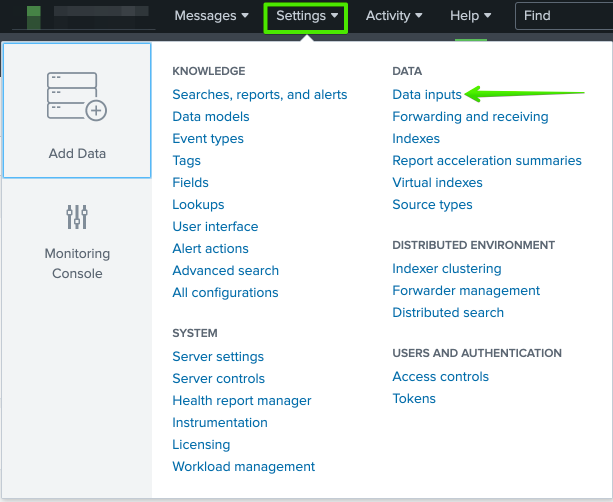
Next select “REST API input for polling data from RESTful endpoints” from the list that is shown.
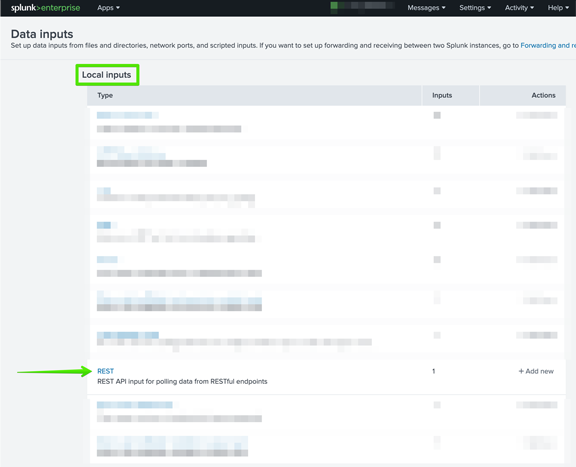
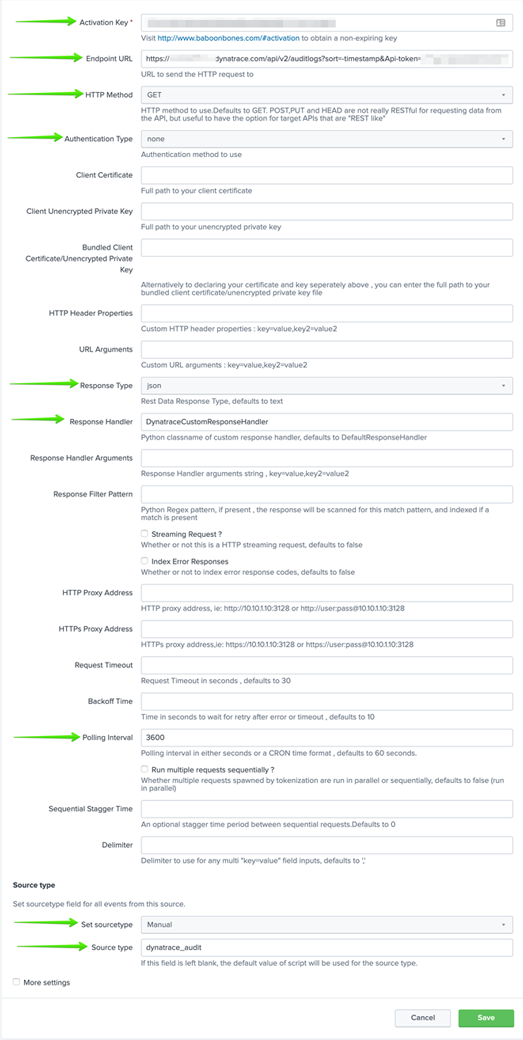
There are 9 key configurations that must be completed on this screen which are as follows:
Activation key
This will be the free 7 day trial key or purchase key you received via email from BaboonBones.
Endpoint URL
This will be the endpoint for your Dynatrace SaaS tenant API along with the generated token you created above. The URL should be constructed as follows:
https://<YOURTENANT NAME HERE>.dynatrace.com/api/v2/auditlogs?sort=timestamp&Api-token=<YOUR TOKEN DYNATRACE TOKEN HERE>
HTTP Method
Select “GET” from the dropdown list.
Authentication Type
Select “none” from the dropdown list.
Response Type
Select “json” from the dropdown list.
Response handler
Type in “DynatraceCustomReponseHandler”.
Polling interval
I would highly recommend no less than 3600.
Set sourcetype
Select “Manual” from the dropdown list.
Source type
Type in “dynatrace_audit” or use whatever you would like as the source type in Splunk Enterprise for Dynatrace logs.
Once you have verified you have all fields completed correctly, press the “Save” button at the bottom of the screen. Below is a screenshot for you to compare too.
Step #5
Provide a nice clean syntax for the json in Splunk Enterprise
In order to clean up from json to a normal Splunk type format, you now need to edit the file called “responsehandlers.py” for the Splunk Enterprise plugin you installed.
In my case, we have Splunk Enterprise installed on a Linux host.
The“responsehandlers.py” file can be found within the “splunk/default/etc/apps/rest_ta/bin” directory.
Once you locate the “responsehandlers.py” file, you will need to edit the file and add the following class logic to the contents. This can really be placed just about anywhere within the file.

Once added, ensure you save the newly edited “responsehandlers.py” file.
This class takes what you would normally see via json output as in the example below and turns it into nice clean Splunk Enterprise entries that are indexed and searchable via the Splunk Enterprise sourcetype you configured above.
That’s it!
At this point you need to restart Splunk Enterprise.
Once Splunk Enterprise has completed the restart, wait about a minute and then give it a test run.
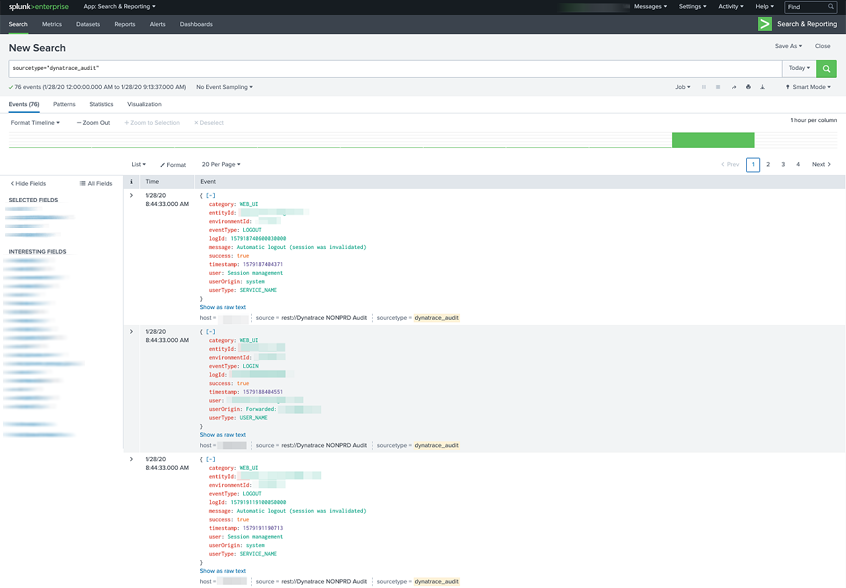
Do a Splunk Enterprise search using sourcetype=”dynatrace_audit” OR use whatever Splunk Enterprise sourcetype you defined in the configuration above.
The results should look something like the following.
Enjoy!
- Mark as New
- Subscribe to RSS Feed
- Permalink
27 Feb 2020 02:14 PM
Thank you so much for this tutorial and the work put in it! From the moderator point of view, it's so amazing to see this kind of engagement and knowledge from the users.
- Mark as New
- Subscribe to RSS Feed
- Permalink
05 May 2020 01:20 PM
You're welcome. I would love to see more of this type of thing. Maybe even a tutorial area of the forum where people could post them.
- Mark as New
- Subscribe to RSS Feed
- Permalink
27 Feb 2020 02:31 PM
Thanks @Larry R. for posting this. We are going to try the addons/plugins one more time and then resort to the API as you have done. Very exciting stuff! thanks again!
- Mark as New
- Subscribe to RSS Feed
- Permalink
27 Feb 2020 03:00 PM
You're welcome! As a side note... I first tried the Dynatrace addons as well. I found them to be very dated and no longer kept up to date. This is what took me down this route. Plus I was not concerned with getting anything else from Dynatrace into Splunk outside of just the audit logs.
Good luck!
- Mark as New
- Subscribe to RSS Feed
- Permalink
19 Apr 2020 02:50 PM
WOW @Larry R. that's is a great and detailed one
Thanks a lot !
Yos
- Mark as New
- Subscribe to RSS Feed
- Permalink
05 May 2020 01:18 PM
You're welcome! Happy to help.
- Mark as New
- Subscribe to RSS Feed
- Permalink
19 Apr 2020 10:36 PM
- Mark as New
- Subscribe to RSS Feed
- Permalink
03 Nov 2022 10:18 PM
Hi @larry_roberts !
Great job ! We are working on an addon.
Did you find a way to replace _time by timestamp from Dynatrace Audit Log ?
Also do you have some dashboards to share? 🙂
Featured Posts
