- Dynatrace Community
- Dynatrace
- Ask
- Log Analytics
- Re: List log files for a metric
- Subscribe to RSS Feed
- Mark Topic as New
- Mark Topic as Read
- Pin this Topic for Current User
- Printer Friendly Page
- Mark as New
- Subscribe to RSS Feed
- Permalink
28 Feb 2023 07:42 AM
Good day.
We building a dashboard that will show the metrics for certain error conditions, with this we want to be able to have that log line to be available on the dashboard. Let me give a easy example. Lets say one of the metrics is to show if a "File not found". If there is a counter for it, we want to display or have a link to the log entry/s for that metric to for example see what file was not found in the log line.
Is this possible and if so, how would this be done?
Thank you.
Solved! Go to Solution.
- Labels:
-
log monitoring classic
-
metrics
- Mark as New
- Subscribe to RSS Feed
- Permalink
28 Feb 2023 12:29 PM
Hi @Brandt74 there is an extension https://www.dynatrace.com/hub/detail/filesystem-monitoring-extension-v2 which can be used to achieve this.
Metrics:
File count: Number of files matching a pattern
File age count: Number of files matching a pattern and an age
File age: Age of a specific file (oldest or newest when returning more than 1 file)
File size: Size of the files in bytes
File mounted: Is a file mounted on Unix NFS
use cases
Path examples:
- Count the number of log files inside /var/log/myapp
Select check type = count
Path = /var/log/myapp/*.log - Count the number of log files inside c:\temp
Select check type = count
Path = c:\temp*.log - Count the number of logs files inside /var/log/myapp and any subdirectories
Select check type = count
Path = /var/log/myapp/**/*.log - Return the total size of all files files inside /var/log/myapp
Select check type = size
Path = /var/log/myapp/* - Return the age of the oldest file in /tmp/test/
Select check type = modification age
Unselect user newest file
Path = /tmp/test/* - Return the number of log files older than 1 hour in /tmp/test
Select check type = modification age count
Set Age comparison operator to Older than
Set the threshold to 60
Path = /tmp/test/*.log - Check if /data/mount-data is mounted
Select check type = mount point
Path = /data/mount-data - Check that today's log has been produced: /var/mylog20222211.log
Select check type = count
Path = /var/mylogYYYYMMDD.log
Accepts DDMMYYYY, DD-MM-YYYY, DD_MM_YYYY, YYYYMMDD. YYYY-MM-DD, YYYY_MM_DD.
The date will be the local date where the OneAgent/extension is running.
- Mark as New
- Subscribe to RSS Feed
- Permalink
28 Feb 2023 11:00 PM - edited 28 Feb 2023 11:06 PM
Hi @Brandt74
Another solution, Switch on log monitoring v2. Set the log source where you would like to search the "file not found" pattern.
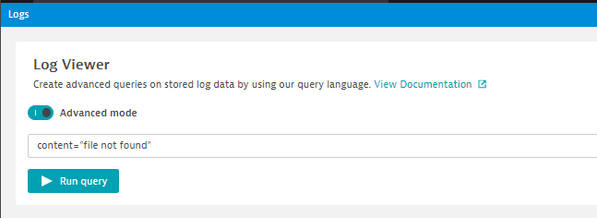
At the log viewer set a filter for the log content pattern "file not found" then:
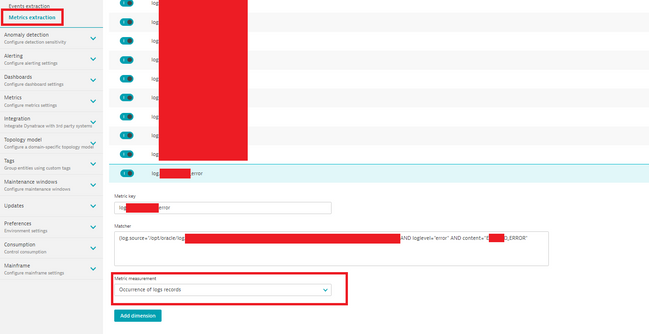
You can create a log metric with the peviously mentioned log filter. Now your "file not found" log lines will be counted. You can vizualize this metric or you can create an alert for the metric.
or You can pin the log filter result to a dashboard, so you can see the filtered log lines on the dashboard.
Regarding the what file question: If you can define well the location of the file name in the log line, you can parse out from the logline with a simple log processing.
Some example:
Simple filter in log viewer for file not found log lines, result can be pinned to a dashboard.
Simple log metric with source and content pattern:
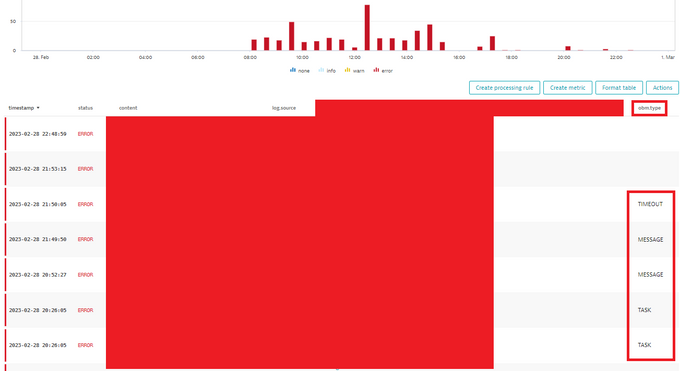
Simple parse a log attribute. Result obm.type value will be propagated based on the log contet after Type:
Above processing rule results in the log viewer if "Type:" is found in a log line:
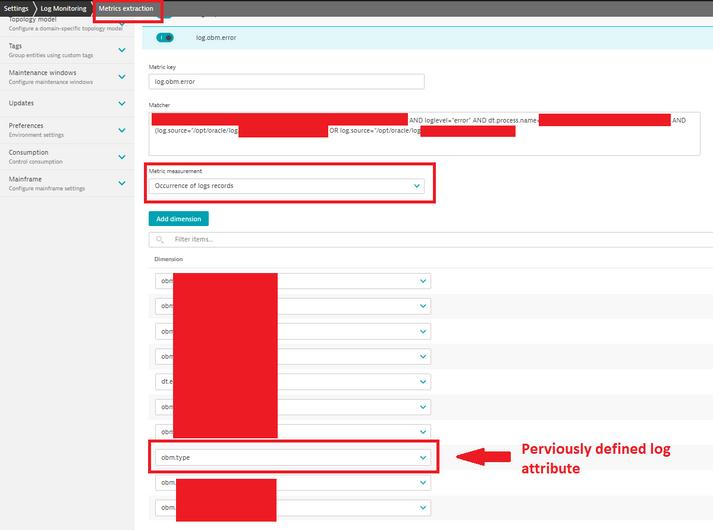
Extra tip: log attributes can be dimensions at a more complex log metric:
At this log metic the error lines counted and the additional dimension is also added. So in data explorer you can split or filer by log attributes (by dimensions)
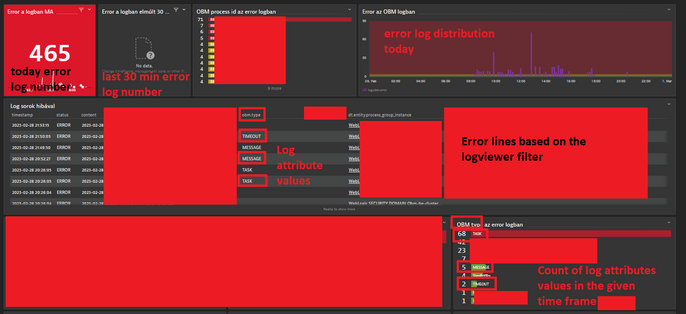
Here is a simple example for log monitoring dashboard:
I hope it helps.
Best regards,
Mizső
