- Dynatrace Community
- Dynatrace
- Ask
- Log Analytics
- Re: Possible Bug on Logs Analytics Metrics to Dashboard.
- Subscribe to RSS Feed
- Mark Topic as New
- Mark Topic as Read
- Pin this Topic for Current User
- Printer Friendly Page
- Mark as New
- Subscribe to RSS Feed
- Permalink
11 Jun 2020 07:32 AM
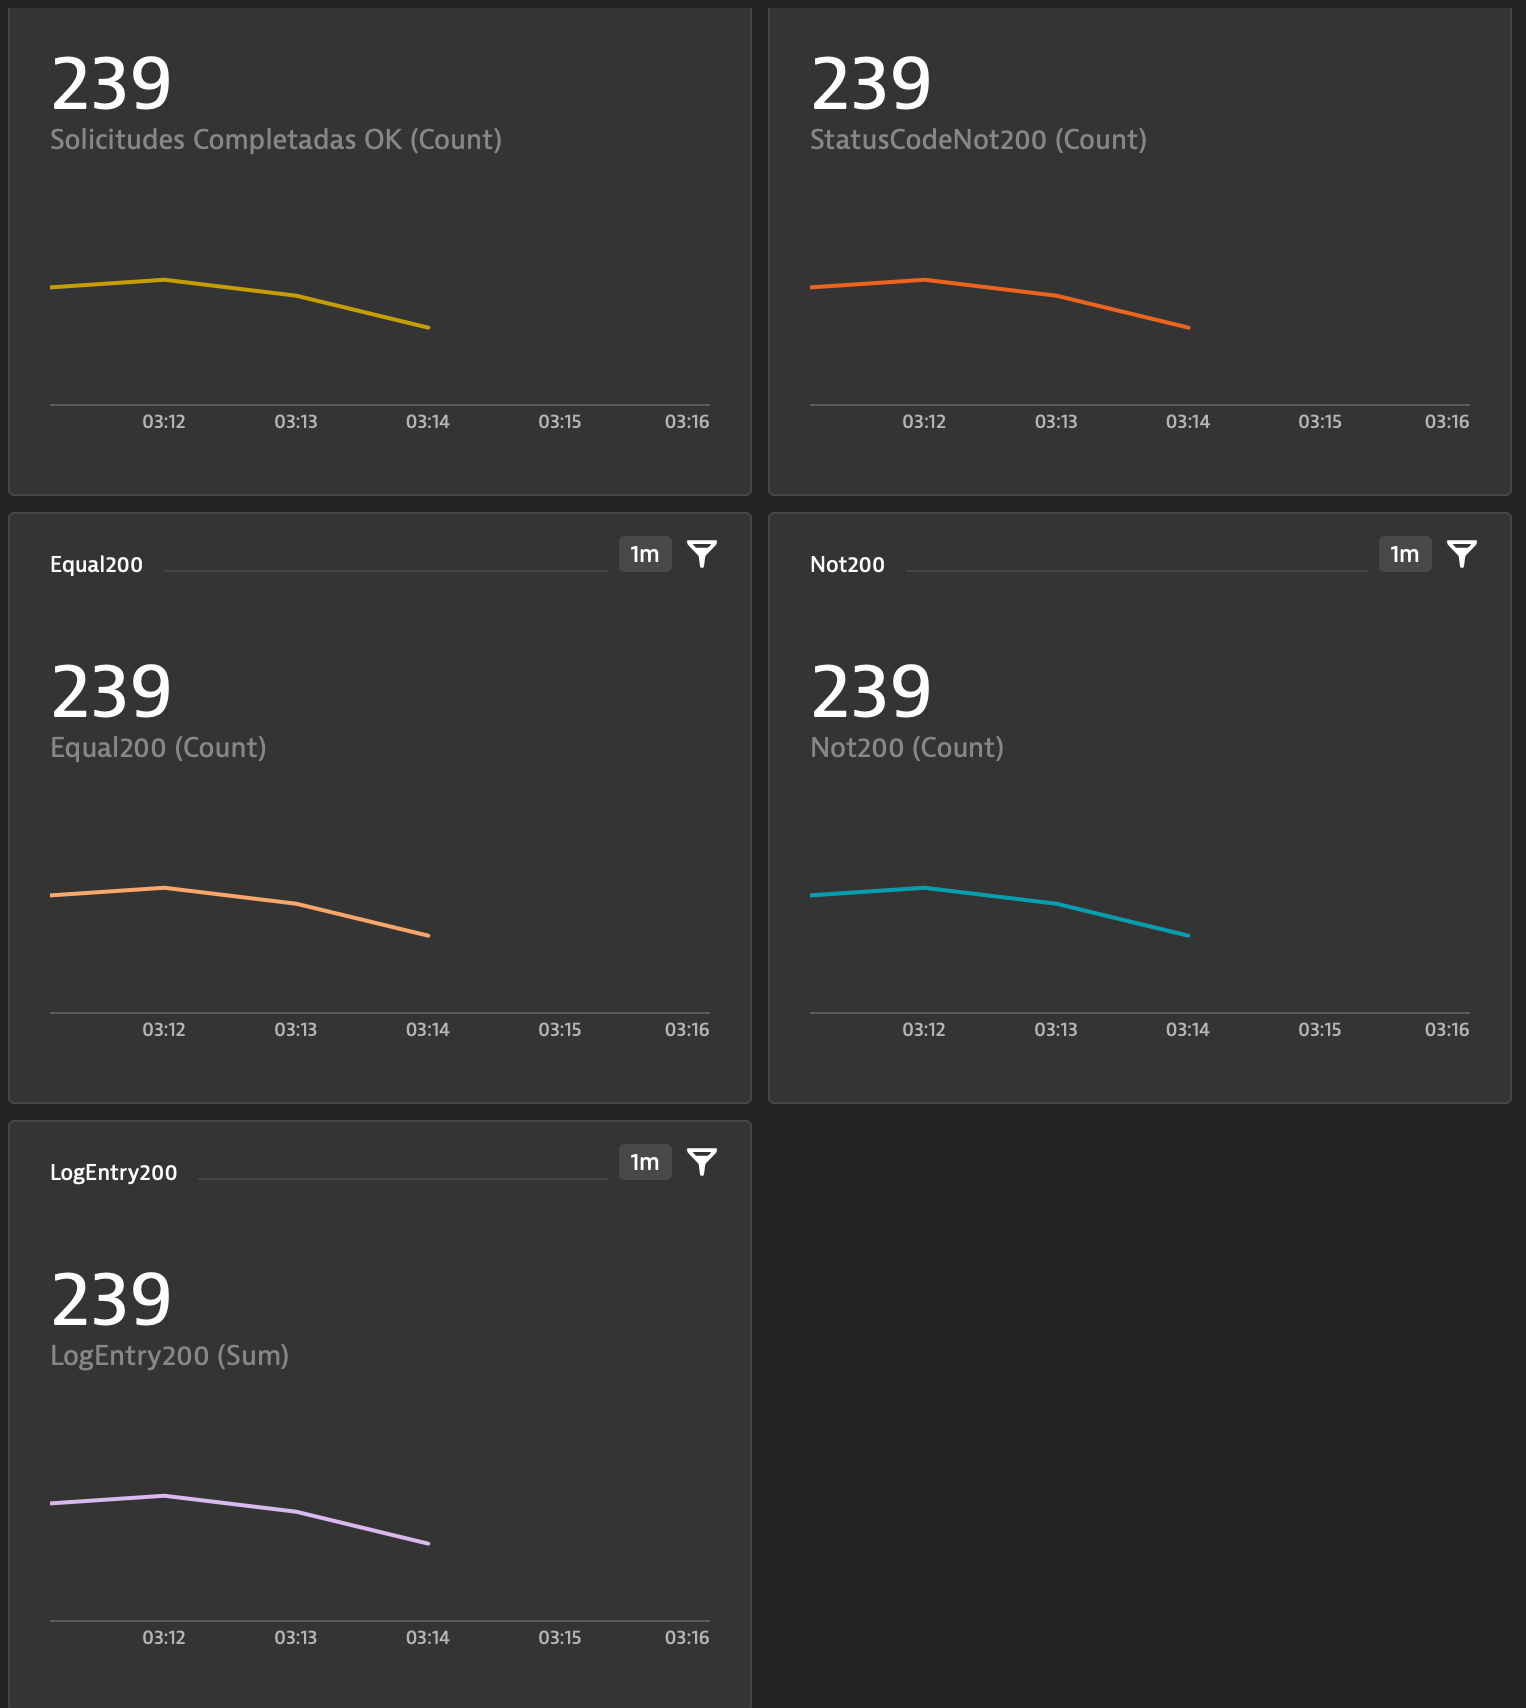
Hello, I'm creating differents metrics from Logs Analytics and inserted into a chart to a Dashboard. I want to check http codes output from a log. The format of the log is JSON.
I download the log to check manually, I went to Logs. I select the log, then the query field is blank and the filter for the column is ie: _json_status=200 and I add the metric as number. I do the same for all the different from 200, just filtering by entering _json_status!=200
I also tried extracting columns, using "\"status\":%{INTEGER:StatusCode}\," and then filter by StatusCode and finally i tried doing a Log Ocurrences option and not numeric, (Here I only can select Sum as an aggregation function) but I always receive the same number in all of them, the number changes, but for all is at a given time, the same.

This is not possible, because I query the .log and I receive the following for all the log:

Just 200 filter:

another error different from 200:

and rest of the world.
Is this a bug or I'm doing something wrong?
How can I obtain the Count for the 200 code and the count for the rest?
Thanks
Solved! Go to Solution.
- Labels:
-
log monitoring classic
- Mark as New
- Subscribe to RSS Feed
- Permalink
16 Jun 2020 09:29 AM
Hey @Daniel S. - could you please share screenshot showing one of metric definition? I think that problem is in "Filter for" which is not included in metric definition (it's not possible in product right now).
