- Dynatrace Community
- Dynatrace
- Ask
- Open Q&A
- 99% other - pure path not helpful, no method hotspot available - how to proceede?
- Subscribe to RSS Feed
- Mark Topic as New
- Mark Topic as Read
- Pin this Topic for Current User
- Printer Friendly Page
99% other - pure path not helpful, no method hotspot available - how to proceede?
- Mark as New
- Subscribe to RSS Feed
- Permalink
27 Jan 2022 02:08 PM
I have some issues with debugging a webplatform on IIS / .net with Dynatrace.
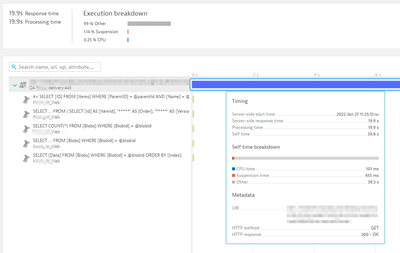
I get random calls that take 2-5 seconds and pure path shows me that a huge part of the time is spent in "other".
Method hotspot is mostly not available for these calls.
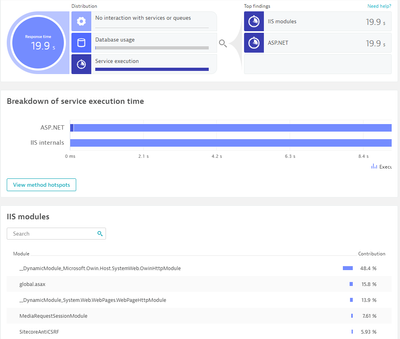
The response time analysis shows me some IIS modules, also some from the framework which is used (Sitecore). But I get no details where the time is spend.
How to proceede?
- Labels:
-
distributed traces classic
-
dotnet
-
iis
- Mark as New
- Subscribe to RSS Feed
- Permalink
27 Jan 2022 04:00 PM
Hi Mathias,
If you have the ability to check in the "Settings" Section go into "Server-side service monitoring" -> "deep monitoring" -> "New OneAgent features"
Here you will find .Net and IIS features. Could you check to see if they are enabled and the app has the minimum agent version? See screenshot:
The "IIS Module Insights" feature in particular should be enabled, but the other ones might help as well depending on the application.
I would suggest turning these on in a lower environment and verifying the app before moving to production as these features will change how the OneAgent injects into your application.
If that does not solve your issue I would suggest opening a ticket with Dynatrace Support.
Hope this helps
Thanks
-Dallas
- Mark as New
- Subscribe to RSS Feed
- Permalink
28 Jan 2022 12:30 PM
Thanks Mr. Dallas
I checked for these, and I couldn't find them. I'm running the latest one Agent. And I assume they are already implemented when I instrumented the system a few weeks ago.
In my opinion the fact that I can see which module is consuming how many percent of the time/cpu(?) I guess already shows that the IIS module are instrumented.


