- Dynatrace Community
- Dynatrace
- Ask
- Open Q&A
- API Definitions - using on Dashboards ans Multidimensional Analysis in Dynatrace Managed
- Subscribe to RSS Feed
- Mark Topic as New
- Mark Topic as Read
- Pin this Topic for Current User
- Printer Friendly Page
API Definitions - using on Dashboards ans Multidimensional Analysis in Dynatrace Managed
- Mark as New
- Subscribe to RSS Feed
- Permalink
10 May 2022
02:29 PM
- last edited on
12 May 2022
02:18 PM
by
![]() MaciejNeumann
MaciejNeumann
Because my other Idea was closed i try it again:
In Dynatrace AppMon there was the "API Breakdown" which made a listing based on the defined APIs regarding Exec Avg, Exec Sum, Cpu Avg, Cput Total....
example:
Now I am looking for a similar view in Dynatrace Managed. I have also configured the "API detection rules" there under "Settings, Server-side service monitoring, API detection rules".
But now I cannot display these API detection rules as example in the "Multidimensional analysis".
For example the Metric CPU Time filtered of API detection rule:
We would like to find out, for example, how much CPU time an API configured under "API detection rule" has used. Does anyone of you have a solution here.
In the documentation the following is written:
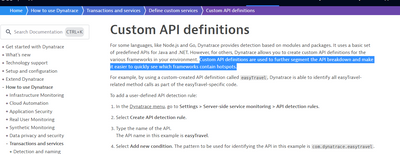
"Custom API definitions are used to further segment the API breakdown and make it easier to quickly see which frameworks contain hotspots."
You can see the APIs in the Method hotspot, but unfortunately that's all. As far as I know, you can neither display the APIs on a dashboard (with Data Explorer) nor analyze the APIs directly (Multidimensional Analysis, split by Dimension API or use a Filter to a API itself).
In the old Post there was an answer about "Method Hotspot" where i can find the "Top API's". It is helpful, but need to use this on Dashboards and probably also in the Multidimensional Analyis.
- Mark as New
- Subscribe to RSS Feed
- Permalink
04 Jun 2022 03:57 AM
Yeah so the Multidimensional Analysis chart is not pinnable at this time to a dashboard. and hotspots cant be on the dashboard either. the closest you can get is a markdown tile with a link to the Multidimensional Analysis chart.


