- Mark as New
- Subscribe to RSS Feed
- Permalink
06 Mar 2018
10:57 AM
- last edited on
28 Sep 2022
11:14 AM
by
![]() MaciejNeumann
MaciejNeumann
Hello,
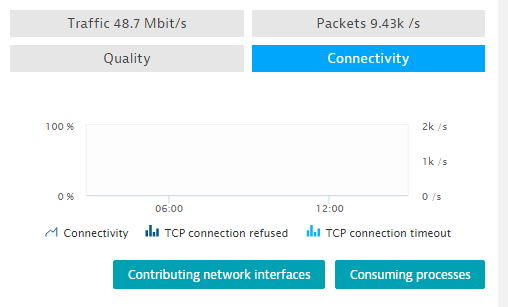
I just found some hosts with no connectivity reported, but incomming/outgoing traffic.
Why just in some cases this is not reported?

Regards
Solved! Go to Solution.
- Labels:
-
hosts classic
- Mark as New
- Subscribe to RSS Feed
- Permalink
06 Mar 2018 02:53 PM
Can you determine what OneAgent version is being used? I checked some support cases and saw that a very similar issue was fixed with version 1.137 (I think this is the most recent).
James
- Mark as New
- Subscribe to RSS Feed
- Permalink
06 Mar 2018 02:55 PM
Internal for reference: https://support.dynatrace.com/supportportal/browse/SUP-6458
- Mark as New
- Subscribe to RSS Feed
- Permalink
07 Mar 2018 08:12 AM
Hey @Rodrigo A.
I had the same problem and I actually created the support ticket @James K. mentioned.
In the recent past, I ran into two different scenarios with low/non-existent host connectivity.
One was already mentioned by James. If you are talking about a Windows/Hyper-V host, there is a good chance that the displayed connectivity is just a bug and will be fixed with agent 137 (Look at the ticket for details). Since its a bug, it is probably not reported as well.
The other issue I tackled was about a host rejecting all incoming requests. Host connectivity is calculated based on the successfully handled requests. Here is the formula:
(connectivitySuccess - (connectivityRefused + connectivityTimeout)) / connectivitySuccess * 100
That means if your host is receiving traffic (like you mentioned) but is rejecting it all (e.g. due to closed ports), the connectivity of that host decreases. In my case, the host was rejecting all incoming requests and therefore had a connectivity of 0%.
You could verify if you are affected by this kind of problem, by looking at the "Transactions & services" section. Try to find a service with 100% failure rate, which is running on a host with low connectivity. Below you see and example. 100% failure rate for requests on port 8610.

Right now we are not always able to see where the rejected traffic is coming from, but I created an RFE for that.
Now back to your question: The connectivity measure can be used as an indicator of whether or not there's network traffic on a host. Please note however that 0% connectivity doesn't necessarily indicate that there is a problem with a host. Assuming no TCP errors are present, it may simply mean that no users have attempted to connect to the host process during the selected time frame.
I hope that helps.
Best,
Max
- Mark as New
- Subscribe to RSS Feed
- Permalink
07 Mar 2018 08:23 AM
If the host is rejecting all traffic you are going to see 0% of connectivity (actual value) on the chart instead of no data. Also one or both of tcp error counters will be high.
- Mark as New
- Subscribe to RSS Feed
- Permalink
07 Mar 2018 09:12 AM
So we have to distinguish 0% connectivity vs. No connectivity. Thank you Pawel
- Mark as New
- Subscribe to RSS Feed
- Permalink
07 Mar 2018 08:25 AM
There's a big difference between incoming/outgoing traffic and connectivity. The last one is measured ONLY for incoming connections. In other words if there's no process monitored on this host that has tcp port opened and incoming network connections, connectivity is not applicable measurement for this host. I'm not sure if that's the case here, but adding this as one of possible scenarios.


