This website uses Cookies. Click Accept to agree to our website's cookie use as described in our Privacy Policy. Click Preferences to customize your cookie settings.
Turn on suggestions
Auto-suggest helps you quickly narrow down your search results by suggesting possible matches as you type.
- Dynatrace Community
- Dynatrace
- Ask
- Open Q&A
- DIagnose CPU Usage for .NET Application
Options
- Subscribe to RSS Feed
- Mark Topic as New
- Mark Topic as Read
- Pin this Topic for Current User
- Printer Friendly Page
DIagnose CPU Usage for .NET Application
Options
- Mark as New
- Subscribe to RSS Feed
- Permalink
17 May 2018 07:21 AM
Hi Guys,
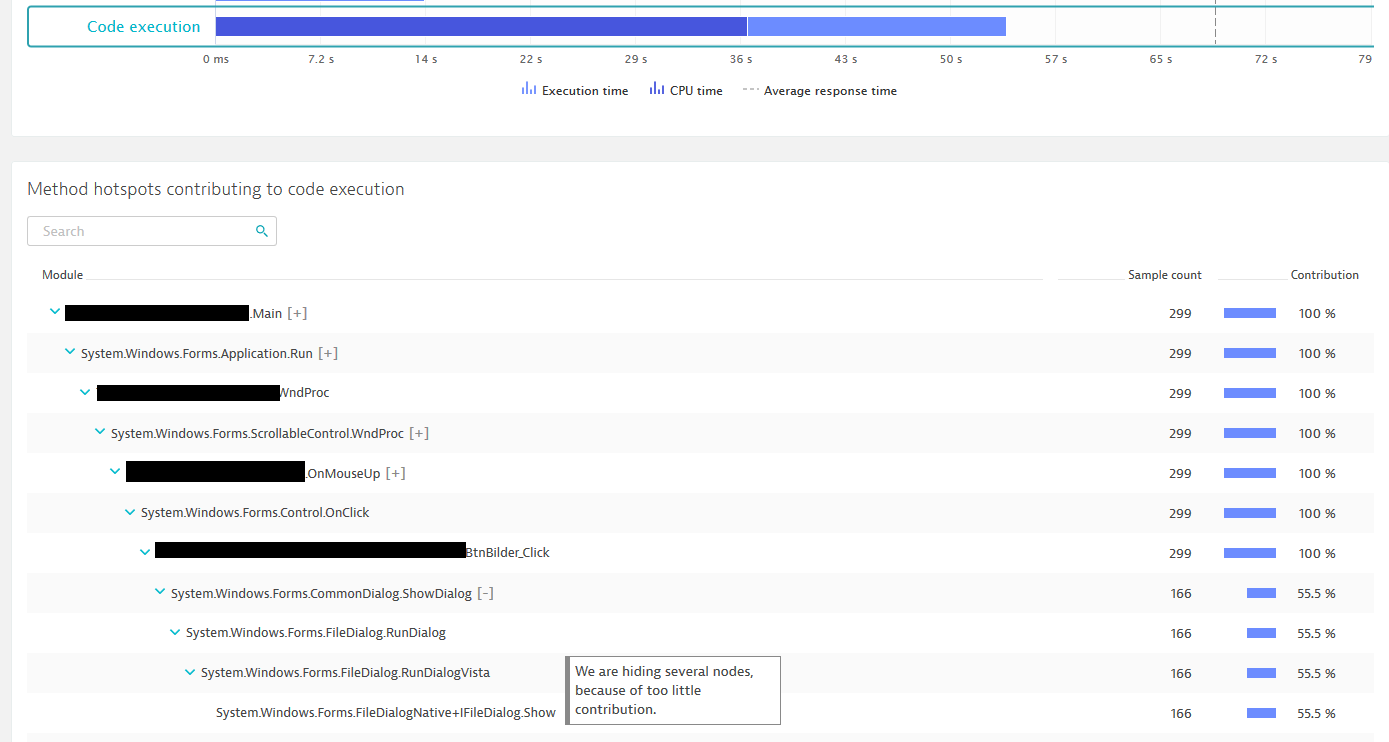
I instruemented a .NET Application with Dynatrace Managed and found a Trace which seems to have a very high CPU contribution. Unfortunately I'm not able to find out why. It seems that the process just opens a Dialog and waits for user Input, I hope that won't use any cpu !?
Do you have any suggestions how I can find the culprit?
regards,
Gerald
Labels:
- Labels:
-
dotnet
-
process groups
-
services classic
5 REPLIES 5
Options
- Mark as New
- Subscribe to RSS Feed
- Permalink
17 May 2018 07:22 AM

Sorry forgot the picture 😉
Options
- Mark as New
- Subscribe to RSS Feed
- Permalink
17 May 2018 09:24 AM
what's inside showdialog ? (click on > near showdialog)
Alanata a.s.
Options
- Mark as New
- Subscribe to RSS Feed
- Permalink
17 May 2018 11:53 AM
I uploaded a picture with all levels expanded.
regards,
Gerald
Options
- Mark as New
- Subscribe to RSS Feed
- Permalink
17 May 2018 02:20 PM
not sure in this case. maybe dialog opens some heavy directory ?
Alanata a.s.
Options
- Mark as New
- Subscribe to RSS Feed
- Permalink
18 May 2018 09:12 AM
Unfortunately I have no details on this application. But shouldn't this be visualized by Dynatrace. In AppMon e.g. we could see IO time.
