- Dynatrace Community
- Dynatrace
- Ask
- Open Q&A
- Display Kubernetes version in a dashboard
- Subscribe to RSS Feed
- Mark Topic as New
- Mark Topic as Read
- Pin this Topic for Current User
- Printer Friendly Page
- Mark as New
- Subscribe to RSS Feed
- Permalink
01 Nov 2023 11:51 AM
We would like to build a dashboard that supports the Infra team, where we show the Kubernetes version for each cluster so that it's easier for them to manage their rollout, check if there are issues with a new deployment and so on...
Unfortunately until now we did not manage to see a Kubernetes metric or how to display this in a dashboard tile
We are using Dynatrace SaaS 1.278.65.20231023-153505
Solved! Go to Solution.
- Mark as New
- Subscribe to RSS Feed
- Permalink
01 Nov 2023 01:20 PM
I do not know of any way to pin the Kubernetes version on the dashboard. The version can be found in properties of each cluster under the Kubernetes tab:
Generally, dashboards are based on metrics and their dimensions, and it is not possible to extract the properties and add them to the dashboard.
Here are all the metrics for Kubernetes that are available in DT (for classic and Grail-based dashboards):
You can try using Metric Ingest to upload the version number from Kubernetes and save it as a metric in DT (this requires some programming work, though). However, it will be easiest to teach the team how to check it in DT.
Radek
- Mark as New
- Subscribe to RSS Feed
- Permalink
01 Nov 2023 01:41 PM
Thank you for the fast response Radek, but the team handles more than 200 clusters and thus manually checking each one is not going to make their life easier
Thanks,
Alex
- Mark as New
- Subscribe to RSS Feed
- Permalink
01 Nov 2023 01:47 PM
Do you have any example or lead on the Metric Ingest solution as, in the end might be an option the team might explore?
Thanks,
Alex
- Mark as New
- Subscribe to RSS Feed
- Permalink
01 Nov 2023 03:02 PM - edited 01 Nov 2023 03:07 PM
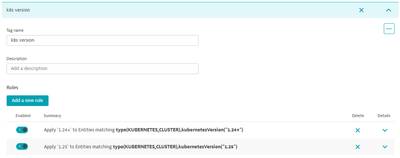
Hi @alexandrumarin, it is not a perfect auto-tag rule, but this is the only way I could figure out how to do it at the moment. The downside: you'd have to set up multiple tag rules to cover all the k8s cluster versions and you'd have to maintain them, but at least you'll have a tag that can be used for filtering.
Perhaps someone out there has a better, cleaner way of handling this, or hopefully the optional tag value and/or k8s version would be options in tag rules in the near future.
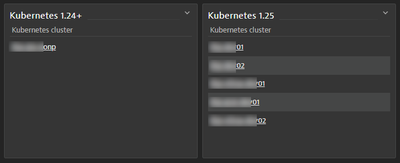
The tag can then be used with the K8s Node Count metric; deselect the Kubernetes: Node count column to only display the cluster name.
The result on a dashboard:
- Mark as New
- Subscribe to RSS Feed
- Permalink
01 Nov 2023 04:23 PM
I agree that it can be approached this way, but as you point out it requires work to maintain the configuration. For large environments this can be a problem.
- Mark as New
- Subscribe to RSS Feed
- Permalink
06 Nov 2023 10:57 AM
Maybe not the answer you are currently looking for if you need to buildup this using the dashboard classic.
But it seems that this is doable with the new dashboard section where you can utilize grail to query the information out.
https://docs.dynatrace.com/docs/observe-and-explore/dashboards-new/get-started/dashboards-use
The query itself could be something like this and by quick test up it's doing the trick you are looking for.
fetch dt.entity.kubernetes_cluster
| fieldsAdd entity.name, kubernetesVersion
| fields kubernetesVersion, entity.name
| sort kubernetesVersion


