- Mark as New
- Subscribe to RSS Feed
- Permalink
08 Feb 2023
07:28 AM
- last edited on
08 Feb 2023
09:04 AM
by
![]() Ana_Kuzmenchuk
Ana_Kuzmenchuk
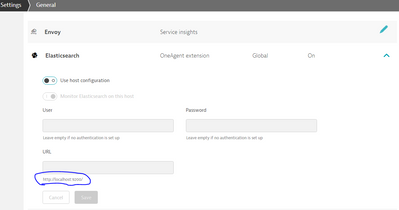
Hi, My scenario is that we hosted 4 ES instances in one on-premise server having different URLs (port number). When I checked in Dynatrace we can't monitor 4 URLs at a time (only1 at a time). Do any option is there to monitor all 4 different URLs to get monitor?. We have separate management zone available respective to the URLS. Tried the shared entity concept but didn't work out.
Solved! Go to Solution.
- Labels:
-
elasticsearch
-
extensions
- Mark as New
- Subscribe to RSS Feed
- Permalink
08 Feb 2023 08:21 AM - edited 08 Feb 2023 08:21 AM
I'm pretty sure it should work. I assume each ES instance has its process. Therefore, each should have at least one service bound to a separate port.
Dynatrace Managed expert
- Mark as New
- Subscribe to RSS Feed
- Permalink
08 Feb 2023 08:41 AM
But how we can add multiple URLs?
- Mark as New
- Subscribe to RSS Feed
- Permalink
08 Feb 2023 08:59 AM
Ah OK. It's clear now. The question is related to the Elasticsearch OneAgent extension. Indeed this supports only 1 Elasticsearch instance per host.
Dynatrace Managed expert
- Mark as New
- Subscribe to RSS Feed
- Permalink
08 Feb 2023 09:22 AM
Any other possibility that we can implement here to monitor multiple instance from one host?
- Mark as New
- Subscribe to RSS Feed
- Permalink
09 Feb 2023 12:04 PM
It is possible with a workaround. In the extension configuration, you should directly point to a Prometheus exporter endpoint instead of an Elasticsearch instance.
Connect all your Elasticsearch endpoints to the Prometheus and then use the extension.
Dynatrace Managed expert


