- Dynatrace Community
- Dynatrace
- Ask
- Open Q&A
- Filtering For Unique Values on a Request Attribute
- Subscribe to RSS Feed
- Mark Topic as New
- Mark Topic as Read
- Pin this Topic for Current User
- Printer Friendly Page
Filtering For Unique Values on a Request Attribute
- Mark as New
- Subscribe to RSS Feed
- Permalink
12 Oct 2023
01:21 PM
- last edited on
13 Oct 2023
08:37 AM
by
![]() MaciejNeumann
MaciejNeumann
Hello all,
For a couple of time I have the need of a special metric.
Let's say there is a header value for each of my clients. Every time a client sends a request to the API, they have a unique key. I have applied my request attribute for this scenerio and merged this request attribute with a certain rule like Rate Limit.
Now I want to calculate how many unique value hit my rule in a certain timeframe. Currently I can only calculate how many times an ID hit the rule or how many times that rule worked in total. I want to calculate each unique value occurence as 1, no matter how many request they have sent in a 1 minute resolution (or whatever my resolution is)
For example some requests in a minute:
Request 1 => Header: MyHeaderValue, Value: A
Request 2 => Header: MyHeaderValue, Value: B
Request 3 => Header: MyHeaderValue, Value: C
Request 4 => Header: MyHeaderValue, Value: B
Request 5 => Header: MyHeaderValue, Value: B
Request 6 => Header: MyHeaderValue, Value: D
As you can see, there are 6 requests to my API. Each have a header key as "MyHeaderValue". But each have a unique value. What I see on Dynatrace are like this
1=> There are 6 requests with MyHeaderValue key or
2=> There are 6 requests, splitting by dimension 1 request from A, 1 request from C, 1 request from D, 3 requests from B
What I want is to show me, => 4 unique values for MyHeaderValue request attribute.
Is there a way to achieve this kind of calculation in data explorer or by metrics api?
Regards.
- Labels:
-
metrics
-
request attributes
- Mark as New
- Subscribe to RSS Feed
- Permalink
12 Oct 2023 03:56 PM
Hi,
I am not sure but maybe if you save those request attributes as user action properties also, and uses USQL some aggregations.
Best regards
- Mark as New
- Subscribe to RSS Feed
- Permalink
13 Oct 2023 07:17 AM
Hi,
Thanks but I have no RUM monitoring. I just have a unique header that arrives at backend which tells me that is a unique client. I would have to do with that header.
- Mark as New
- Subscribe to RSS Feed
- Permalink
13 Oct 2023 07:58 AM
I suspect it will be difficult to achieve the effect you need directly in Dynatrace. I'd recommend you pull metrics from DT into Grafana for example and do the necessary aggregations/calculations there.
Radek
- Mark as New
- Subscribe to RSS Feed
- Permalink
13 Oct 2023 08:39 AM
Even the API filters out some values at some point. I don't want to see an "others" value. I'd need the exact datas from DT so I can make necessary calculations at somewhere else. Is it possible?
I have maybe thousands of unique values in each minute. I can only limit 100 values in an API call
- Mark as New
- Subscribe to RSS Feed
- Permalink
13 Oct 2023 08:32 AM
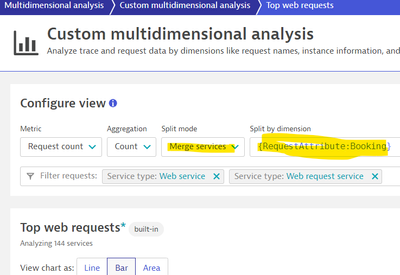
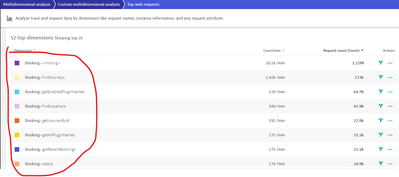
you can do this by using the request attribute itself as a dimension and use merge service instead ofsplit by service as shown in the below figures you'll get the desired result
if you spanning specific service you can filter by it.
BR,
Mostafa Hussein.
- Mark as New
- Subscribe to RSS Feed
- Permalink
13 Oct 2023 08:35 AM
That is not applicable to me. There are hundreds of different values. I want to see unique value count on a graph.
- Mark as New
- Subscribe to RSS Feed
- Permalink
13 Oct 2023 08:49 AM
in this case you have to create custom metric, accordingly you can make a tile on dashboard using this custom metric and pick the top 10, 20 as you like to get a hotspot on the top trending request attribute values.
- Mark as New
- Subscribe to RSS Feed
- Permalink
13 Oct 2023 08:54 AM
No, that is not my issue. The issue is there are hundreds maybe thousands of unique value in each minute. Some maybe occur 4 times, 5 times in a minute. I want to eliminate those reoccurs and only calculate the number of unique values in a minute. Let's say there are 6K values in 09:00 but only 2K unique values. I don't want any top 10-20 etc.. I have created a custom metric but I am not able to see unique values in a time frame.
- Mark as New
- Subscribe to RSS Feed
- Permalink
13 Oct 2023 09:00 AM
as we know the multidimensional analysis is exactly designed for aggregation results so we can leverage it, take a deep look on the 1st screenshot i've sent, you'll see that the result is a unique values not single values you can try it yourself in the desired environment.
regarding the timeframe within the tile settings you can set it and have the variety for filtration.
- Mark as New
- Subscribe to RSS Feed
- Permalink
16 Oct 2023 09:55 AM
This is one of our best times. I need something to count Booking=* unique values and show them as it is on the graph. Finding out "Booking=findJourneys" has 100 requests on 09:49 on the graph is not helpful at all. I need to know how many Booking=* unique values in each minute and draw the graph with number of unique values in each minute.
- Mark as New
- Subscribe to RSS Feed
- Permalink
13 Oct 2023 08:52 AM
for optimizing DDU consumption you can restrict your metric datasource on specific management zones, specific services which you knows it's critical


