Turn on suggestions
Auto-suggest helps you quickly narrow down your search results by suggesting possible matches as you type.
- Dynatrace Community
- Dynatrace
- Ask
- Open Q&A
- Re: Host availability State Metric showing No_Data
Options
- Subscribe to RSS Feed
- Mark Topic as New
- Mark Topic as Read
- Pin this Topic for Current User
- Printer Friendly Page
Host availability State Metric showing No_Data
Options
- Mark as New
- Subscribe to RSS Feed
- Permalink
30 Jan 2024
01:34 PM
- last edited on
30 Jan 2024
01:40 PM
by
![]() Ana_Kuzmenchuk
Ana_Kuzmenchuk
Hi Team,
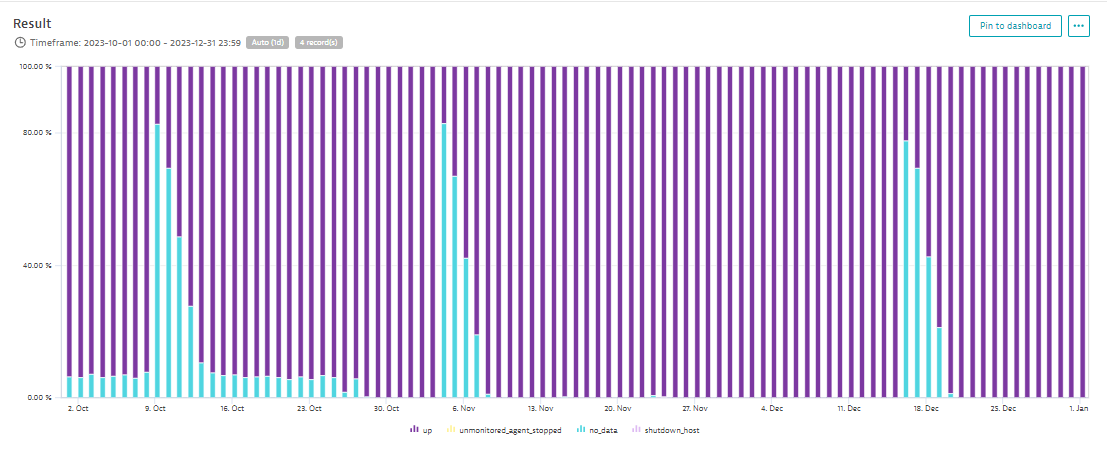
We are trying to plot the host availability state metric for a specific host but while plotting on the graph we are able to see some host statuses such as up, unmonitored Agent stopped, No_data, and shutdown PFB Snapshot. Can anyone please help me understand what No_Data means as checked in Docs( N0_data indicates the host is working and Oneagent is active, but no data is being sent )but as checked the st Host level it is up and running and the network is also fine.


Labels:
- Labels:
-
host monitoring
-
metrics
host metric.png
18 KB
3 REPLIES 3
Options
- Mark as New
- Subscribe to RSS Feed
- Permalink
30 Jan 2024 03:00 PM
Hi,
You can check host availability states here.
Indicates that the host is working and OneAgent is active, but no data is being sent.Best regards
❤️ Emacs ❤️ Vim ❤️ Bash ❤️ Perl
Reply
Options
- Mark as New
- Subscribe to RSS Feed
- Permalink
30 Jan 2024 03:43 PM
It appears there might be some confusion between Host Availability and OA (OneAgent) monitoring.
To put it simply, Dynatrace keeps an eye on the "state" of each host, depending on messages from OneAgent. It's not as simple as "OneAgent sends data, so the host is active."
In certain cases or network issues, the host might show a "NO Data" state, even if OneAgent is sending metrics. This happens because messages from the OS agent, like "I'm shutting down" or "I'm back online," might not reach Dynatrace, causing a difference in the reported host state.
Reply
Options
- Mark as New
- Subscribe to RSS Feed
- Permalink
30 Jan 2024 08:27 PM
Hi PacoPorro,
Thanks for the information but as checked on the host level there was no network issue observed during the observed time frame.PFB snapshot

