- Dynatrace Community
- Dynatrace
- Ask
- Open Q&A
- Log Event for Custom Log Ingestion
- Subscribe to RSS Feed
- Mark Topic as New
- Mark Topic as Read
- Pin this Topic for Current User
- Printer Friendly Page
Log Event for Custom Log Ingestion
- Mark as New
- Subscribe to RSS Feed
- Permalink
29 Nov 2022 06:16 AM
Hi,
We are writing custom logs from external source into Dynatrace. The content contains information about the response time of certain web requests/action.
The log viewer can filter data based on selecting specific values detected (i.e there is no greater than or less than), so how can we filter (in log viewer) or create an event whenever Dynatrace detects a request that took more than 5000 ms (for example)? The key here is the "more than" (not equal to)
Thanks
- Labels:
-
log monitoring classic
- Mark as New
- Subscribe to RSS Feed
- Permalink
02 Dec 2022 04:39 PM
Hi @DynaQ,
I have tried to find a solution for you but I am failed. Maybe you or anyone else could reuse some part of it.
I have created a log pars for an access log where there were response time data.
PARSE(content, "IPADDR:'net.peer.ip'
' - -'
' [' HTTPDATE:timestamp ']'
SPACE
'\"'
LD:'http.method'
SPACE
LD:'http.target'
SPACE
LD:'http.flavor'
'\"'
SPACE
INT:'http.status_code'
SPACE
INT:'http.response_time'
")
This was the sample content:
"content": "www.zzz.yyy.xxx - - [02/Dec/2022:14:19:17 +0100] \"GET /sdsd/v1/process/7296447 HTTP/1.1\" 200 145 ",
This is the result:
{
"content": "www.zzz.yyy.xxx - - [02/Dec/2022:14:19:17 +0100] \"GET /sdsd/v1/process/7296447 HTTP/1.1\" 200 145 ",
"timestamp": "2022-12-02T13:19:17.000000000 +0000",
"event.type": "LOG",
"status": "NONE",
"loglevel": "NONE",
"dt.entity.process_group": "PROCESS_GROUP-xxx",
"http.target": "/sdsd/v1/process/7296447",
"http.flavor": "HTTP/1.1",
"dt.entity.process_group_instance": "PROCESS_GROUP_INSTANCE-xxx",
"log.source": "/opt/oracle/domains/X_DOMAIN/servers/sdsd/logs/access.log",
"net.peer.ip": "www.zzz.yyy.xxx",
"dt.entity.host": "HOST-xxx",
"process.technology": [
"Java",
"Oracle WebLogic"
],
"http.status_code": "200",
"http.response_time": "145",
"http.method": "GET"
}
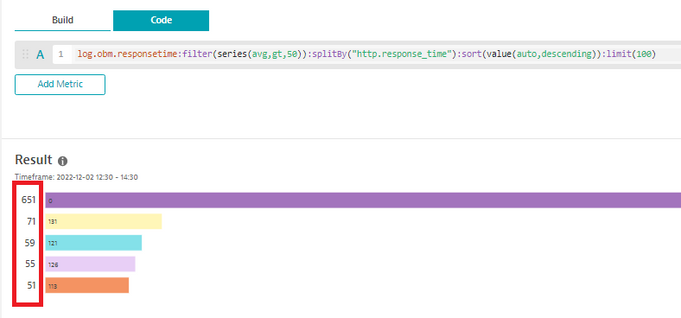
I have created a 2 types of log metrics from the http.response_time for test purposes (please find attached).
Then I have tried to vizualize it and use the filter (with gt - greater than) method without success, because the filter applied for the occurances of the individual response times. Maybe sombody can correct my solution form the community.
I hope it helps.
Best regards,
Mizső

