- Dynatrace Community
- Dynatrace
- Ask
- Open Q&A
- Not able to see Process metric for Node.js application
- Subscribe to RSS Feed
- Mark Topic as New
- Mark Topic as Read
- Pin this Topic for Current User
- Printer Friendly Page
Not able to see Process metric for Node.js application
- Mark as New
- Subscribe to RSS Feed
- Permalink
12 Sep 2022
08:11 AM
- last edited on
12 Sep 2022
02:51 PM
by
![]() Ana_Kuzmenchuk
Ana_Kuzmenchuk
Hello,
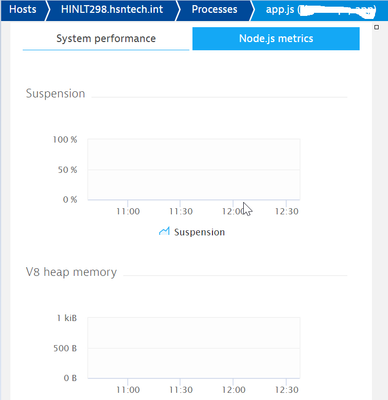
I am new to Dynatrace and trying to explore its capabilities. I have installed OneAgent on my host and am trying to monitor CPU and memory usage. I am able to see the monitoring graph for CPU and memory usage. But while checking Node.js metrics for my application I can't see an event loop or suspension graph.
Screenshot when I tried with Application which I want to monitor:
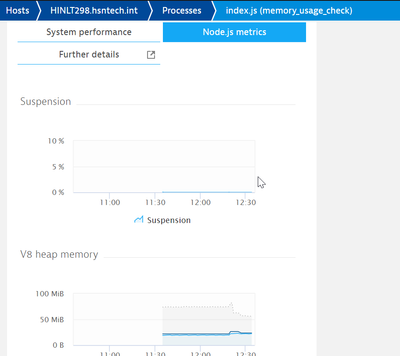
When I tried with sample Node.js application, I can see Node.js metrics (Event loop and suspension graphs) for sample application .
Screenshot when I tried with Sample nodeJs app:
Thanks in advance 🙂
- Labels:
-
application monitoring
-
nodejs
-
oneagent
- Mark as New
- Subscribe to RSS Feed
- Permalink
12 Sep 2022 03:07 PM
Hello Surendra, we're happy to see you join us! Maybe while you're waiting for an answer from the Community, you'd like to familiarize yourself with the below documents (check "Further Reading", too):
https://www.dynatrace.com/support/help/technology-support/application-software/nodejs#
Hope it helps. Have a good day!


