This website uses Cookies. Click Accept to agree to our website's cookie use as described in our Privacy Policy. Click Preferences to customize your cookie settings.
Turn on suggestions
Auto-suggest helps you quickly narrow down your search results by suggesting possible matches as you type.
- Dynatrace Community
- Dynatrace
- Ask
- Open Q&A
- Re: PurePath Duration in Dynatrace
Options
- Subscribe to RSS Feed
- Mark Topic as New
- Mark Topic as Read
- Pin this Topic for Current User
- Printer Friendly Page
PurePath Duration in Dynatrace
Options
- Mark as New
- Subscribe to RSS Feed
- Permalink
02 Feb 2021 11:42 AM
Good day
In Appmon, we had a PurePath Duration metrics, but in Dynatrace does not have it.
Dynatrace have a metrics: Response time and Processing time
This does not correspond to the metric that is required to analyze the entire transaction
I give a description that I found on the AppMon forum:
Response Time: is the Total Execution time of the Entry Point Method that starts the PurePath (=Exec Time Root Node).
Duration: This is the time from the First Event we receive from a PurePath until the last Event that we receive.
Does anyone know if there is a PurePath Duration metric in the roadmap?
Or maybe can we calculated it using SDK?
Labels:
- Labels:
-
distributed traces classic
Reply
7 REPLIES 7
Options
- Mark as New
- Subscribe to RSS Feed
- Permalink
02 Feb 2021 12:15 PM
Hello @Mikhail A.
Have a glance at the below links. It may a little help you out.
Service analysis operates with many different timings, describing the behavior of the service.
The elapsed time from when the first byte of the server response is received until either when the last byte of the current document of the response is received or when the response completes, whichever happens first.
The duration of a user action can be broken down into three components:
- Network time: the time required for data transfer
- Server time: the time consumed on the server side
- Frontend time: the time required for the browser to render the page
Regards,
Babar
Options
- Mark as New
- Subscribe to RSS Feed
- Permalink
02 Feb 2021 01:33 PM
Hello @Babar Q.
Thank you for link!
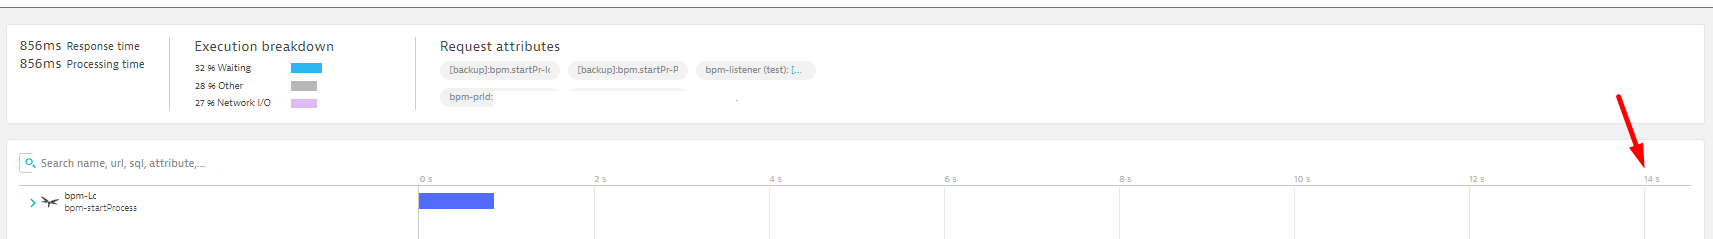
Ok, this is my Purepath.
Which metric need I use you to display time of 14 second on dashboard Custom chart ?
Options
- Mark as New
- Subscribe to RSS Feed
- Permalink
02 Feb 2021 01:41 PM
Hello @Mikhail A.
You have the following 3 options to plot the chart and verify:
- Server Side Response time (The time between moments when PurePath is started on the server-side and when the response is sent back to the client.)
- Processing Time (The duration of the PurePath from start to end.)
- Execution time (The total time is taken to execute the code.)
Regards,
Babar
Options
- Mark as New
- Subscribe to RSS Feed
- Permalink
02 Feb 2021 01:52 PM
I did not find Execution time metric for chart and for creating in UI
Could you please show me screen this metrics on UI?
Could you please say me which metric i need you for my case (see my screen)
Options
- Mark as New
- Subscribe to RSS Feed
- Permalink
02 Feb 2021 02:11 PM
sorry, could you see my screen?

I specifically noted that I need 14 seconds on the chart
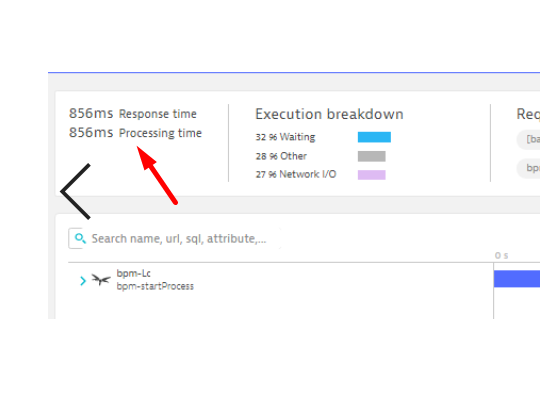
Also You can see that response time and processing time for this purepath = 856ms
Also Could you please show me screen for Execution time metrics on UI?
And how can I create it for request ?
Regards!
Options
- Mark as New
- Subscribe to RSS Feed
- Permalink
02 Feb 2021 02:17 PM
Hello @Mikhail A.
OK, I understand. Can you try to plot the chart with the Client-Side response time and check?
Regards,
Babar
