- Dynatrace Community
- Dynatrace
- Ask
- Open Q&A
- Re: Rename Legend in Chart, Graph
- Subscribe to RSS Feed
- Mark Topic as New
- Mark Topic as Read
- Pin this Topic for Current User
- Printer Friendly Page
- Mark as New
- Subscribe to RSS Feed
- Permalink
13 Jan 2022
08:27 AM
- last edited on
25 Mar 2022
01:13 PM
by
![]() MaciejNeumann
MaciejNeumann
Hello together
Have any of you already mastered a similar situation:
I need to build dashboards for an internal client. Therefore the customer wants to use a different legend in the graphic than suggested by Dynatrace (for example, make names more understandable). Is this possible?
Have a good one!
Urs
Solved! Go to Solution.
- Labels:
-
dashboards classic
- Mark as New
- Subscribe to RSS Feed
- Permalink
13 Jan 2022 12:21 PM
Hi, @urs_fischer ,
Yes, it can be done!
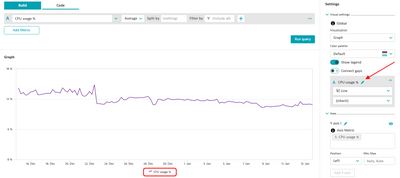
If you're using Data Explorer to make your graphs, you just have to head over to the grey box on the right-side of the screen, which contains the configs for the metric you're charting.
There you just have to click the little "pencil" icon:
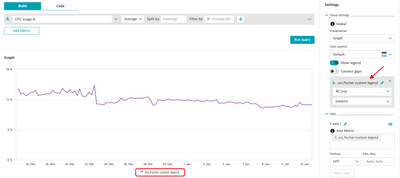
After clicking, you write your desired legend, hit enter on your keyboard and that's it!
For example, on that example, I was charting "CPU usage %".
But I could want to change it to "urs_fischer custom legend":
Hope this helps! 🙂
- Mark as New
- Subscribe to RSS Feed
- Permalink
13 Jan 2022 12:50 PM
Well, see your approach, with this i can do some changes, but not all i have to 😉
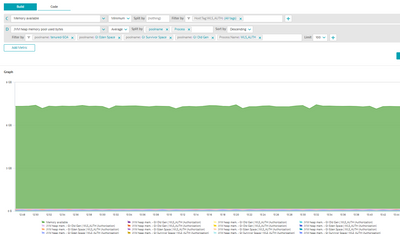
I can change the Metric Name (here JVM heap pool memory) but i can not change the Rest of it after the "|" . I know this Name comes from the Process Group Name, but is it possible to change that too or do i have to rename the whole Process Groups just because of that?
- Mark as New
- Subscribe to RSS Feed
- Permalink
13 Jan 2022 01:11 PM - edited 13 Jan 2022 07:16 PM
Oh, I see... that could be a bit trickier 😄
As far as I know, it is not possible to create aliases for each entity in a metric query result...
I assume it isn't possible at all out-of-the-box.
However, I believe there is a workaround that could suit your needs, if the set of aliases is of a manageable size!
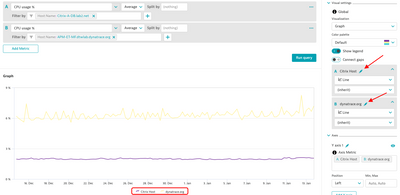
You could create a Data Explorer metric filtered by each desired entity, and change the legend (like I showed on the previous comment) for each one.
It could be really tedious work if you have a lot of entities to chart, but it is doable.
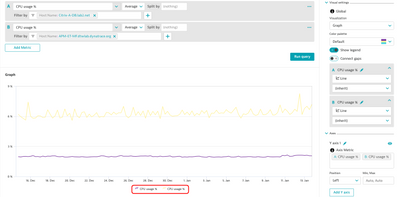
In this example, I'm again charting CPU usage.
This time, twice: one for each filtered host.
Then, I apply the alias method I showed earlier and achieve something closely related to what I think you're looking for:
BEFORE
AFTER
Again: it is a workaround, but it is there 🙂
- Mark as New
- Subscribe to RSS Feed
- Permalink
14 Jan 2022 12:03 PM
@PedroDeodato Yeah, could work for some cases (i saw this is limited from A-E per default). Sadly i have some Graphs with more than 5.... but yes it is a Workaround 👍
