- Dynatrace Community
- Dynatrace
- Ask
- Open Q&A
- Re: Response time hotspot - network IO time
- Subscribe to RSS Feed
- Mark Topic as New
- Mark Topic as Read
- Pin this Topic for Current User
- Printer Friendly Page
- Mark as New
- Subscribe to RSS Feed
- Permalink
15 Mar 2023
11:44 AM
- last edited on
16 Mar 2023
07:35 AM
by
![]() MaciejNeumann
MaciejNeumann
We have an application which is like an integration layer. This application which interacts with other applications, gets information and processes the response from them, collates a response and send it back to requester. It integrates with multiple applications. We have observed that the application's response time increases multi-fold if network IO time increases. In general it is around 50ms. However when it crosses 250ms, the application gets slower 3 times. Recently we have observed network IO was showing 750ms and the application was 5 times slow. It affects all the API calls.
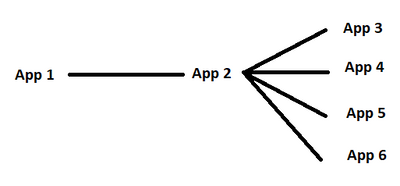
Here is rough interactions with in different applications
For this analysis we have taken "Service Flow" for App1. What all interactions contributes to network IO time? Is it time between App1 and App2 only OR it sums network time between all like app1-app2, app2-app3, app2-app4, app2-app4, app2-app5, app2-app5?
Thanks,
Vikrant.
Solved! Go to Solution.
- Labels:
-
metrics
-
network monitoring
- Mark as New
- Subscribe to RSS Feed
- Permalink
22 Mar 2023 02:46 PM
Network time is the time where we detect an application is waiting for network traffic to arrive.
In the case of response time analysis this does not include any child calls.
More infos on timings here: https://www.dynatrace.com/support/help/platform-modules/applications-and-microservices/services/anal...

