- Dynatrace Community
- Dynatrace
- Ask
- Open Q&A
- Understanding Response times in PurePath
- Subscribe to RSS Feed
- Mark Topic as New
- Mark Topic as Read
- Pin this Topic for Current User
- Printer Friendly Page
- Mark as New
- Subscribe to RSS Feed
- Permalink
06 Jun 2022 10:08 AM
Hi Guys,
Let talk about Purepaths (traces)
In the bellow example
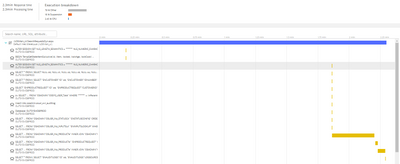
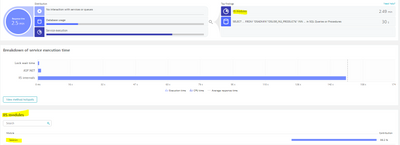
The PurePaths Response time is 2.5 min.
The database Request is 30sec.
I see
thanks to whoever is going to comment.
BRs,
Solved! Go to Solution.
- Labels:
-
distributed traces classic
- Mark as New
- Subscribe to RSS Feed
- Permalink
06 Jun 2022 10:29 AM
Examine method hotspots on the ASP.NET node for this PurePath and the code level tab information.
- Mark as New
- Subscribe to RSS Feed
- Permalink
06 Jun 2022 12:04 PM
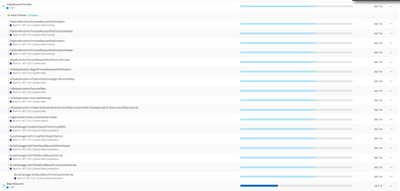
This is what I can observe:
- Mark as New
- Subscribe to RSS Feed
- Permalink
06 Jun 2022 12:42 PM
Sorry, clicked "Accept as solution" instead of "Reply".
@Malaik, was this observed during a recycle/restart of an app pool?
- Mark as New
- Subscribe to RSS Feed
- Permalink
06 Jun 2022 12:51 PM
Thanks @AntonioSousa
I just discover this kind of purepaths after navigating in Problems.
But I can see this in the root cause section in the problem
So, what is the relation between all those elements?
- Mark as New
- Subscribe to RSS Feed
- Permalink
06 Jun 2022 03:32 PM
See that you are using OutSystems 😁
When it crashes, the app pool has to be restarted, and the restart has to do a lot of things. All requests that come in during that phase will get locking, due namely to .Net compilations and other restarting needs...
- Mark as New
- Subscribe to RSS Feed
- Permalink
07 Jun 2022 03:19 AM
Hi @Malaik
I have observed this in many customer places who are using ASP.NET. It is an expected behaviour from Dynatrace. Dynatrace works in such a way that it captures the details of the most important methods that are under execution and not every method the program executes will be captured in PurePaths - This is because to reduce the overhead on the application by OneAgent and deep monitoring. In order to look at this, what you can do is to create custom service for those methods and capture the details on what is happening.
As per the screenshot, the timing data is around 70% is spent on other that means that time which the request has took is unmonitored by Dynatrace or Dynatrace is not able to detect what that timing is. It just shows other as the result of the remaining of final response time of the request.
- Mark as New
- Subscribe to RSS Feed
- Permalink
07 Jun 2022 04:17 AM - edited 07 Jun 2022 04:22 AM
Hey, this could be due to adaptive traffic control
Do check this related solution Solved: Re: Purepath - Dynatrace Community
And refer this documentation Errors of PurePath® capture | Dynatrace Docs


