This website uses Cookies. Click Accept to agree to our website's cookie use as described in our Privacy Policy. Click Preferences to customize your cookie settings.
Turn on suggestions
Auto-suggest helps you quickly narrow down your search results by suggesting possible matches as you type.
- Dynatrace Community
- Dynatrace
- Ask
- Open Q&A
- Re: view request count (over time) per service to a custom device
Options
- Subscribe to RSS Feed
- Mark Topic as New
- Mark Topic as Read
- Pin this Topic for Current User
- Printer Friendly Page
view request count (over time) per service to a custom device
Options
- Mark as New
- Subscribe to RSS Feed
- Permalink
30 Jan 2021 03:25 PM
Hi,
i have a custom device, is it possible to see requests count over time for all calling entities on a graph?
Labels:
- Labels:
-
services classic
11 REPLIES 11
Options
- Mark as New
- Subscribe to RSS Feed
- Permalink
30 Jan 2021 03:30 PM
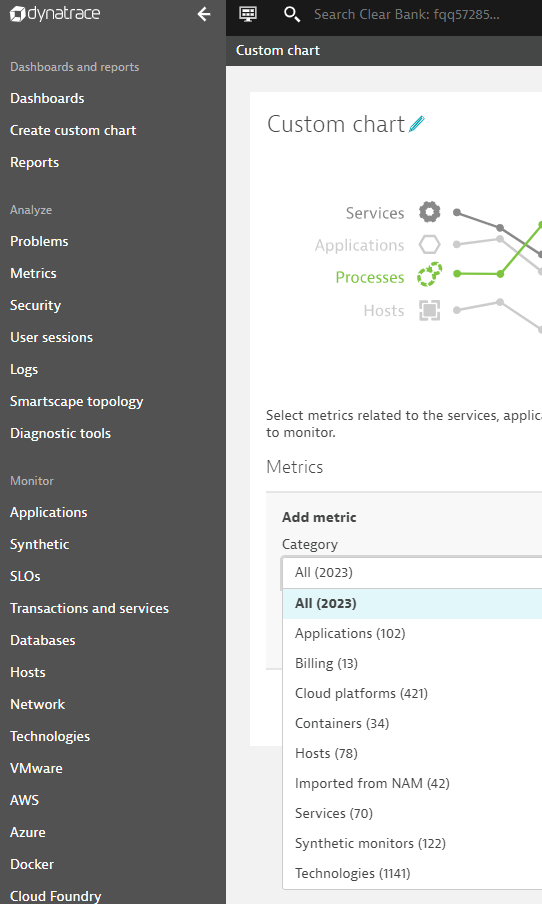
If you go to create a custom chart, and select Custom, there is a whole bunch of options on how to chart custom devices 🙂
-Chad
Options
- Mark as New
- Subscribe to RSS Feed
- Permalink
01 Feb 2021 08:45 AM
can you point me to this Custom option? i don't see it after clicking create custom chart.

Options
- Mark as New
- Subscribe to RSS Feed
- Permalink
02 Feb 2021 03:52 AM
i'm not seeing it, could it be a permission or licence issue?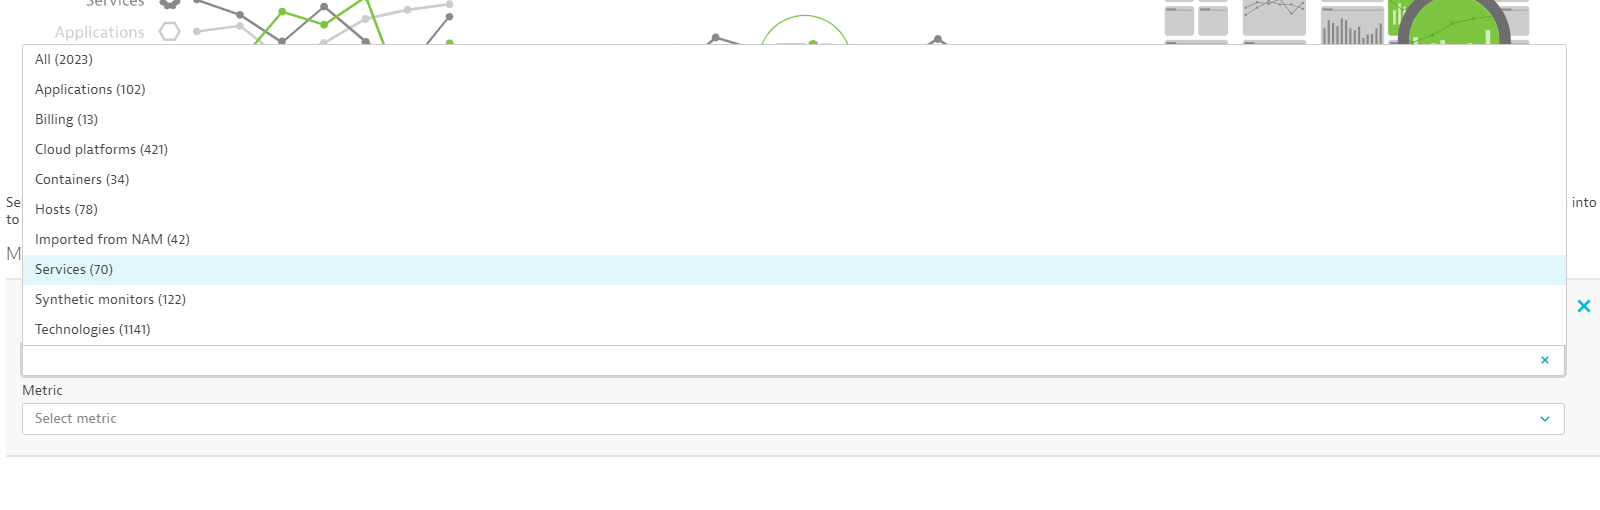
Options
- Mark as New
- Subscribe to RSS Feed
- Permalink
10 Feb 2021 03:38 PM
Hey @Chad T. , any thoughts on why i'm not seeing this option? could it be permission or license issue?
Options
- Mark as New
- Subscribe to RSS Feed
- Permalink
10 Feb 2021 03:40 PM
Interesting, what is your cluster version? Are you Managed or SaaS? are you a Dynatrace Admin?

-Chad
Options
- Mark as New
- Subscribe to RSS Feed
- Permalink
10 Feb 2021 05:16 PM
we're using the SaaS version with 1.210.92.20210209-151321
Options
- Mark as New
- Subscribe to RSS Feed
- Permalink
31 Jan 2021 09:36 AM
unfortunately i don't see Custom as a Category
Options
- Mark as New
- Subscribe to RSS Feed
- Permalink
01 Feb 2021 02:03 PM
Hello Mike R.
Simply create a custom chart e.g. Response time (Count) and filter for the services which are part of your custom device.
Regards,
Babar
Options
- Mark as New
- Subscribe to RSS Feed
- Permalink
10 Feb 2021 03:50 PM
theres 994 services 🙂 i want to know top services (by calls) to that custom device.
Options
- Mark as New
- Subscribe to RSS Feed
- Permalink
11 Feb 2021 06:54 AM
Hello Mike R.
The custom device metrics did not work for me as well except the counting of a number of custom devices, therefore, I adopted the shared method with you 🙂
Regards,
Babar
